Additional point quiz 1
Please read and follow below tutorials and answer the quiz. It will provide additional points.
metagenomics
Metagenomics is the study of genetic material recovered directly from environmental or clinical samples. The broad field may also be referred to as environmental genomics, ecogenomics, community genomics or microbiomics.
making the working directory
echo $USER

cd /data/gpfs/assoc/bch709-3/${USER}

mkdir -p /data/gpfs/assoc/bch709-3/${USER}/metagenome/fastq
mkdir  /data/gpfs/assoc/bch709-3/${USER}/metagenome/database

cd /data/gpfs/assoc/bch709-3/${USER}/metagenome
Environment creation
## Environment installation and install kraken2
conda create -n BCH709_metagenome -c bioconda -c conda-forge -c anaconda kraken2 -y

## Activate environment
conda activate BCH709_metagenome

## move to folder
cd /data/gpfs/assoc/bch709-3/${USER}/metagenome

## Braken installtation
git clone https://github.com/jenniferlu717/bracken
cd bracken/
bash install_bracken.sh
cd /data/gpfs/assoc/bch709-3/${USER}/metagenome
Activate environment
conda activate BCH709_metagenome
Link fastq file
ln -s /data/gpfs/assoc/bch709-3/Course_materials/metagenome/*.fastq /data/gpfs/assoc/bch709-3/${USER}/metagenome/fastq
Link database file
ln -s /data/gpfs/assoc/bch709-3/Course_materials/metagenome/database/* /data/gpfs/assoc/bch709-3/${USER}/metagenome/database
Investigate taxa
Here we introduce a software called Kraken2. This tool uses k-mers to assign a taxonomic labels in form of NCBI Taxonomy to the sequence (if possible). The taxonomic label is assigned based on similar k-mer content of the sequence in question to the k-mer content of reference genome sequence. The result is a classification of the sequence in question to the most likely taxonomic label. If the k-mer content is not similar to any genomic sequence in the database used, it will not assign any taxonomic label.
Kraken2
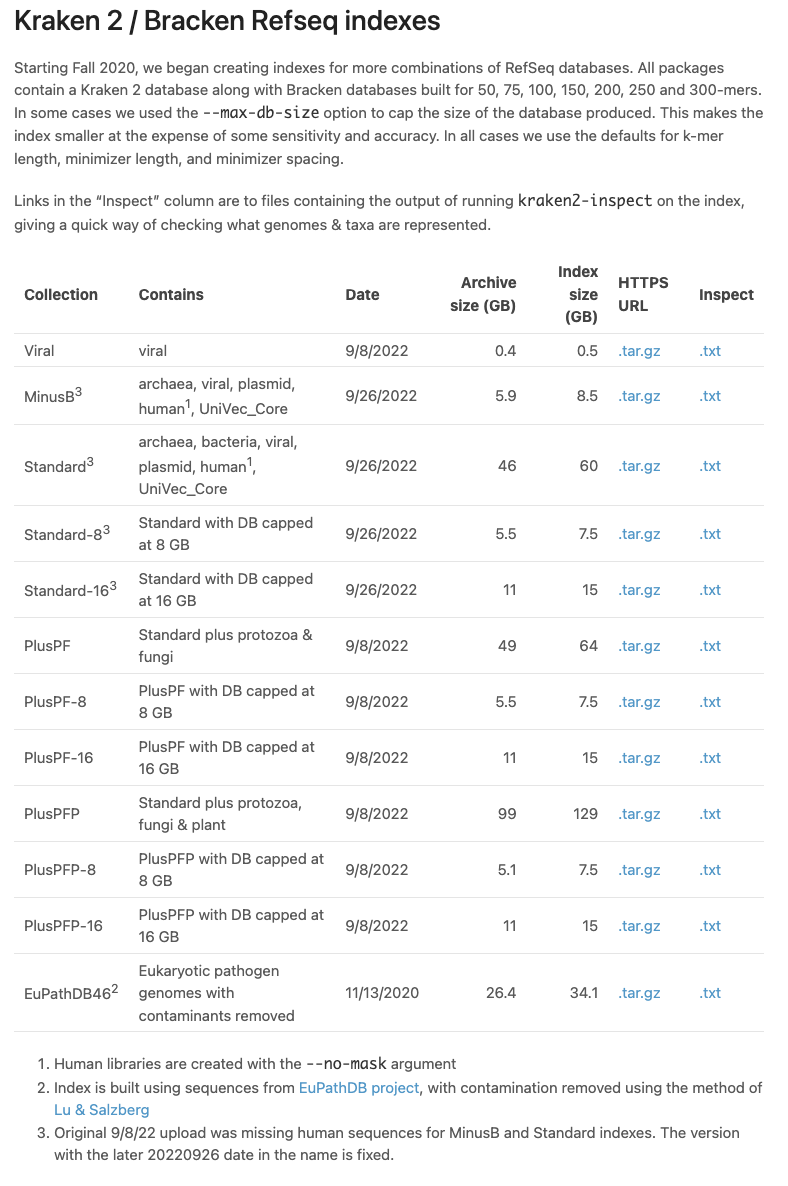
Kraken 2, KrakenUniq and Bracken indexes Kraken 2 is a fast and memory efficient tool for taxonomic assignment of metagenomics sequencing reads. Bracken is a related tool that additionally estimates relative abundances of species or genera. See the Kraken 2 manual for more information about the individual libraries and their relationship to public repositories like Refseq. See also the Kraken protocol for advice on how to use it. https://www.nature.com/articles/s41596-022-00738-y
https://benlangmead.github.io/aws-indexes/k2
Braken
Bracken stands for Bayesian Re-estimation of Abundance with KrakEN, and is a statistical method that computes the abundance of species in DNA sequences from a metagenomics sample [LU2017]. Bracken uses the taxonomy labels assigned by Kraken2 (see above) to estimate the number of reads originating from each species present in a sample. Bracken classifies reads to the best matching location in the taxonomic tree, but does not estimate abundances of species. Combined with the Kraken classifier, Bracken will produces more accurate species- and genus-level abundance estimates than Kraken2 alone.
The use of Bracken subsequent to Kraken2 is optional but might improve on the Kraken2 results.
The most recent database
Kraken 2 database (Standard 46G) includes archaea, bacteria, viral, plasmid, human1, UniVec_Core has been downloaded in below from https://benlangmead.github.io/aws-indexes/k2 We already linked decompress database by ln command above.
Create file list
cd /data/gpfs/assoc/bch709-3/${USER}/metagenome/fastq


ls -1 *.fastq | sed 's/\.fastq//g' | sort -u > /data/gpfs/assoc/bch709-3/${USER}/metagenome/filelist

cat /data/gpfs/assoc/bch709-3/${USER}/metagenome/filelist
Copy templet
cp /data/gpfs/assoc/bch709-3/Course_materials/metagenome/run.sh /data/gpfs/assoc/bch709-3/${USER}/metagenome/metagenome.sh

sed -i "s/16g/128g/g; s/\-\-cpus\-per\-task\=2/\-\-cpus\-per\-task\=2/g; s/\[NAME\]/Metagenome/g; s/\[youremail\]/${USER}\@unr.edu\,${USER}\@nevada.unr.edu/g" /data/gpfs/assoc/bch709-3/${USER}/metagenome/metagenome.sh
Create submission files and submit jobs
KRAKEN_DB=/data/gpfs/assoc/bch709-3/${USER}/metagenome/database
READ_LEN=75
CLASSIFICATION_LVL=S
THRESHOLD=10

for i in `cat /data/gpfs/assoc/bch709-3/${USER}/metagenome/filelist`
    do
    cd /data/gpfs/assoc/bch709-3/${USER}/metagenome
    rm ${i}.sh
    read1=${i}.fastq
    # Use Kraken2 to classify
    echo "kraken2  --threads 2 --report ${i}.kreport --db /data/gpfs/assoc/bch709-3/${USER}/metagenome/database /data/gpfs/assoc/bch709-3/${USER}/metagenome/fastq/${read1}" | cat /data/gpfs/assoc/bch709-3/${USER}/metagenome/metagenome.sh - > ${i}.sh
    #Now, we can use Bracken on the Kraken2 results to improve them.
    echo "python /data/gpfs/assoc/bch709-3/${USER}/metagenome/bracken/src/est_abundance.py  -i ${i}.kreport -k ${KRAKEN_DB}/database${READ_LEN}mers.kmer_distrib -l ${CLASSIFICATION_LVL} -t ${THRESHOLD} -o ${i}.bracken"  >> ${i}.sh
    chmod 775 ${i}.sh
    sbatch ${i}.sh
done
Results
Any results file for example SRR19419492_bracken_species.kreport
I would recommend to use less.
less SRR19419492_bracken_species.kreport
To get out of less please use q
We can use the webpage NCBI TaxIdentifier to quickly get the names to the taxonomy identifier. However, this is impractical as we are dealing potentially with many sequences. Kraken2 has some scripts that help us understand our results better.
Because we used the Kraken2 switch –report FILE, we have got also a sample-wide report of all taxa found. This is much better to get an overview what was found.
The first few lines of an example report are shown below.
100.00  8682916 0       R       1       root
58.26   5058623 0       D       10239     Viruses
58.26   5058530 0       D1      2559587     Riboviria
58.26   5058530 0       K       2732396       Orthornavirae
58.26   5058519 0       P       2732408         Pisuviricota
58.26   5058519 0       C       2732506           Pisoniviricetes
58.26   5058519 0       O       76804               Nidovirales
58.26   5058519 0       O1      2499399               Cornidovirineae
58.26   5058519 0       F       11118                   Coronaviridae
58.26   5058519 0       F1      2501931                   Orthocoronavirinae
58.26   5058519 0       G       694002                      Betacoronavirus
58.26   5058519 0       G1      2509511                       Sarbecovirus
58.26   5058459 5058459 S       694009                          Severe acute respiratory syndrome-related coronavirus
0.00    59      0       G2      2720068                         unclassified Sarbecovirus
0.00    59      59      S       864596                            Bat coronavirus BM48-31/BGR/2008
0.00    11      0       P       2732406         Kitrinoviricota
0.00    11      0       C       2732461           Alsuviricetes
0.00    11      0       O       2732544             Martellivirales
0.00    11      0       F       675071                Virgaviridae
0.00    11      0       G       12234                   Tobamovirus
0.00    11      11      S       1761477                   Tomato brown rugose fruit virus
The output of kraken-report is tab-delimited, with one line per taxon. The fields of the output, from left-to-right, are as follows:
- Percentage of reads covered by the clade rooted at this taxon
- Number of reads covered by the clade rooted at this taxon
- Number of reads assigned directly to this taxon
- A rank code, indicating (U)nclassified, (D)omain, (K)ingdom, (P)hylum, (C)lass, (O)rder, (F)amily, (G)enus, or (S)pecies. All other ranks are simply “-“.
- NCBI Taxonomy ID
- The indented scientific name
If you want to compare the taxa content of different samples to another, one can create a report whose structure is always the same for all samples, disregarding which taxa are found (obviously the percentages and numbers will be different).
We can cerate such a report using the option –report-zero-counts which will print out all taxa (instead of only those found). We then sort the taxa according to taxa-ids (column 5), e.g. sort -n -k5.
The report is not ordered according to taxa ids and contains all taxa in the database, even if they have not been found in our sample and are thus zero. The columns are the same as in the former report, however, we have more rows and they are now differently sorted, according to the NCBI Taxonomy id.
Braken results
We used Bracken on the Kraken2 results to improve them. The species-focused result-table looks similar to this:
name    taxonomy_id     taxonomy_lvl    kraken_assigned_reads   added_reads     new_est_reads   fraction_total_reads
Vibrio sp. THAF191c     2661921 S       122     6517    6639    0.00076
Calditerrivibrio nitroreducens  477976  S       30      2       32      0.00000
Vibrio sp. THAF191d     2661922 S       116     5221    5337    0.00061
Thermosulfuriphilus ammonigenes 1936021 S       10      18      28      0.00000
Candidatus Pseudomonas adelgestsugas    1302376 S       21      0       21      0.00000
Bacillus velezensis     492670  S       313     1657    1970    0.00023
Acinetobacter sp. WCHA55        2004646 S       11      35      46      0.00001
Acinetobacter sp. WCHA45        2004644 S       31      188     219     0.00003
Coprothermobacter proteolyticus 35786   S       27      0       27      0.00000
Ahniella affigens       2021234 S       32      2       34      0.00000
Candidatus Chromulinivorax destructor   2066483 S       26      0       26      0.00000
Paralysiella testudinis 2809020 S       61      150     211     0.00002
Bacteroides sp. CBA7301 2715212 S       29      4       33      0.00000
Halarcobacter bivalviorum       663364  S       101     29      130     0.00001
Microvirgula aerodenitrificans  57480   S       720     1209    1929    0.00022
Alistipes communis      2585118 S       559     330     889     0.00010
Klebsiella huaxiensis   2153354 S       12      3       15      0.00000
Basilea psittacipulmonis        1472345 S       532     234     766     0.00009
Janthinobacterium tructae       2590869 S       88      1738    1826    0.00021
The important column is the new_est_reads, which gives the newly estimated reads by Braken
fraction_total_reads indicated the fraction for corresponding species.
Below command will provide Severe acute respiratory syndrome-related coronavirus in waste water sample SRR19419492.
egrep 694009 SRR19419492.bracken
Visualization by Pavian
Pavian is a web application for exploring metagenomics classification results, with a special focus on infectious disease diagnosis. Pinpointing pathogens in metagenomics classification results is often complicated by host and laboratory contaminants as well as many non-pathogenic microbiota. With Pavian, researchers can analyze, display and transform results from the Kraken and Centrifuge classifiers using interactive tables, heatmaps and flow diagrams. Pavian also provides an alignment viewer for validation of matches to a particular genome.
https://ccb.jhu.edu/software/pavian/
Pavian output for hierarchical visualization.
Please go to https://fbreitwieser.shinyapps.io/pavian/
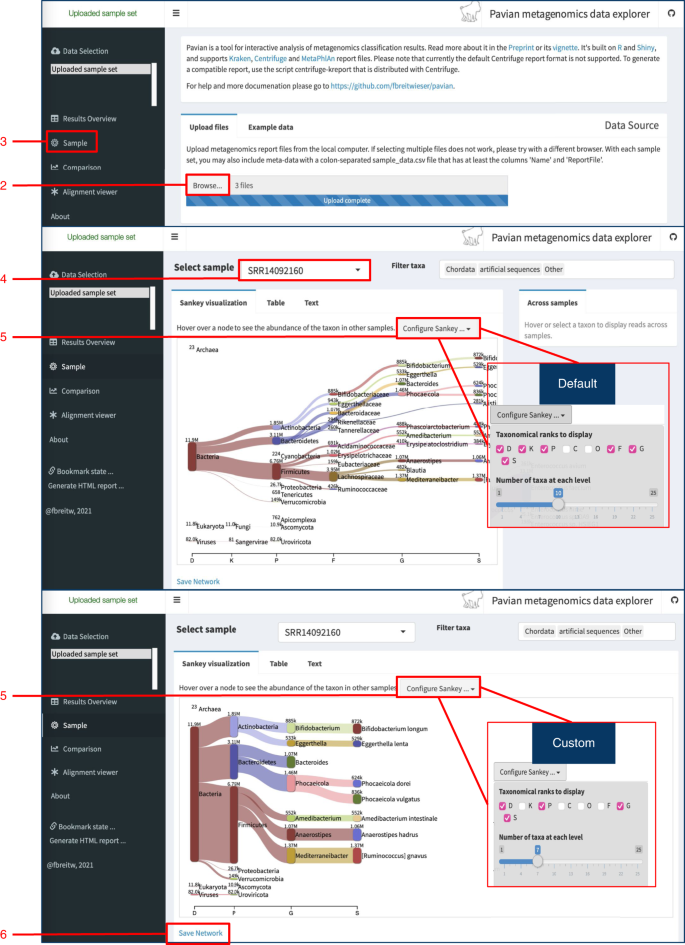
Upon (1) opening the Pavian app, users should (2) upload the microbiome sample files. (3) Choose ‘Sample’ to view classification visualization results. (4) Select sample from the drop-down menu. (5) Select plot settings to customize visualization. (6) Save image of network.
Sample Download
Please download *_bracken_species.kreport in your local computer
Upload to Pavian
Please upload *_bracken_species.kreport to Pavian. You could upload multiple file at once.
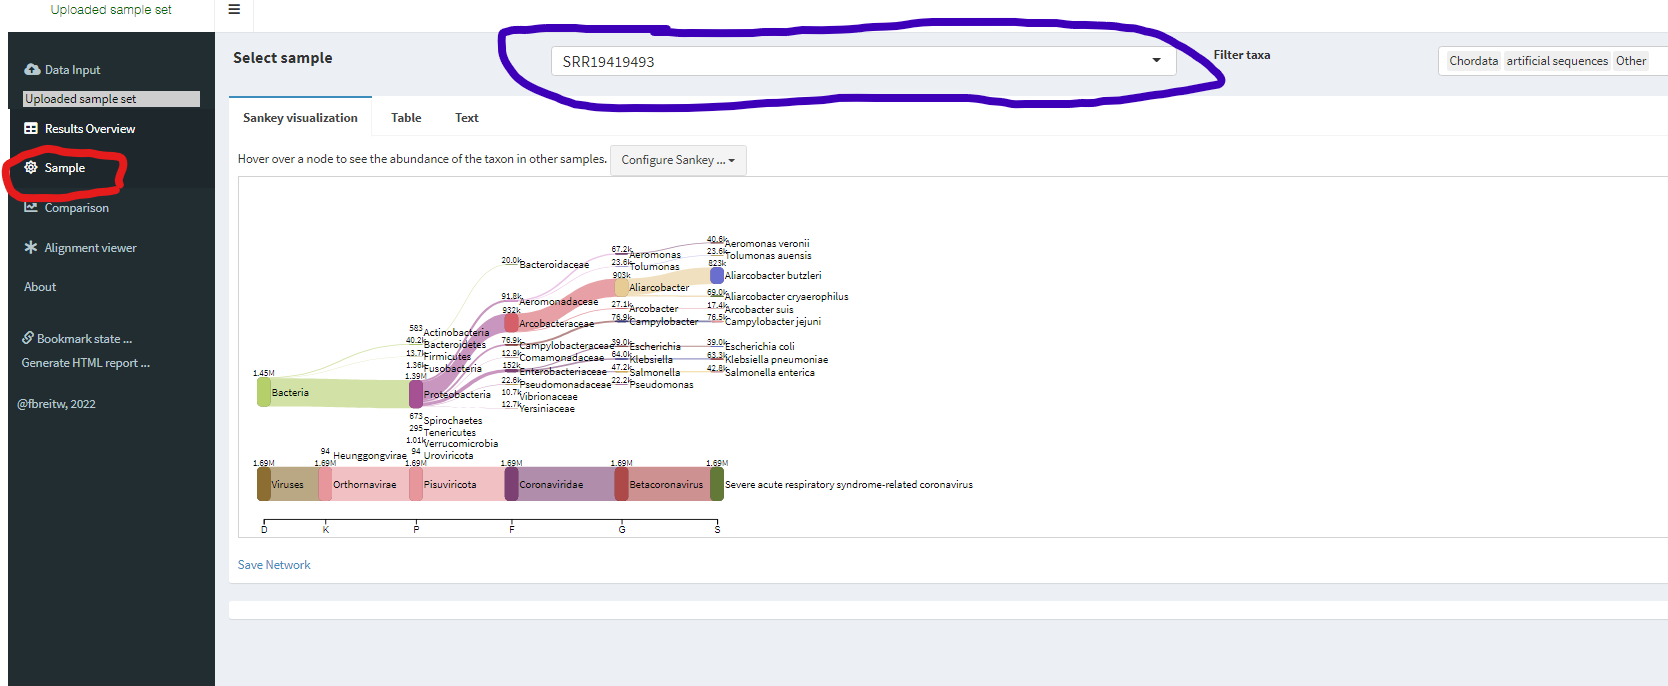
Check Sankey graph
Click Sample on your left (RED circle) and explorer multiple different samples by using drop down menu on top (PURPLE oval)
Quiz
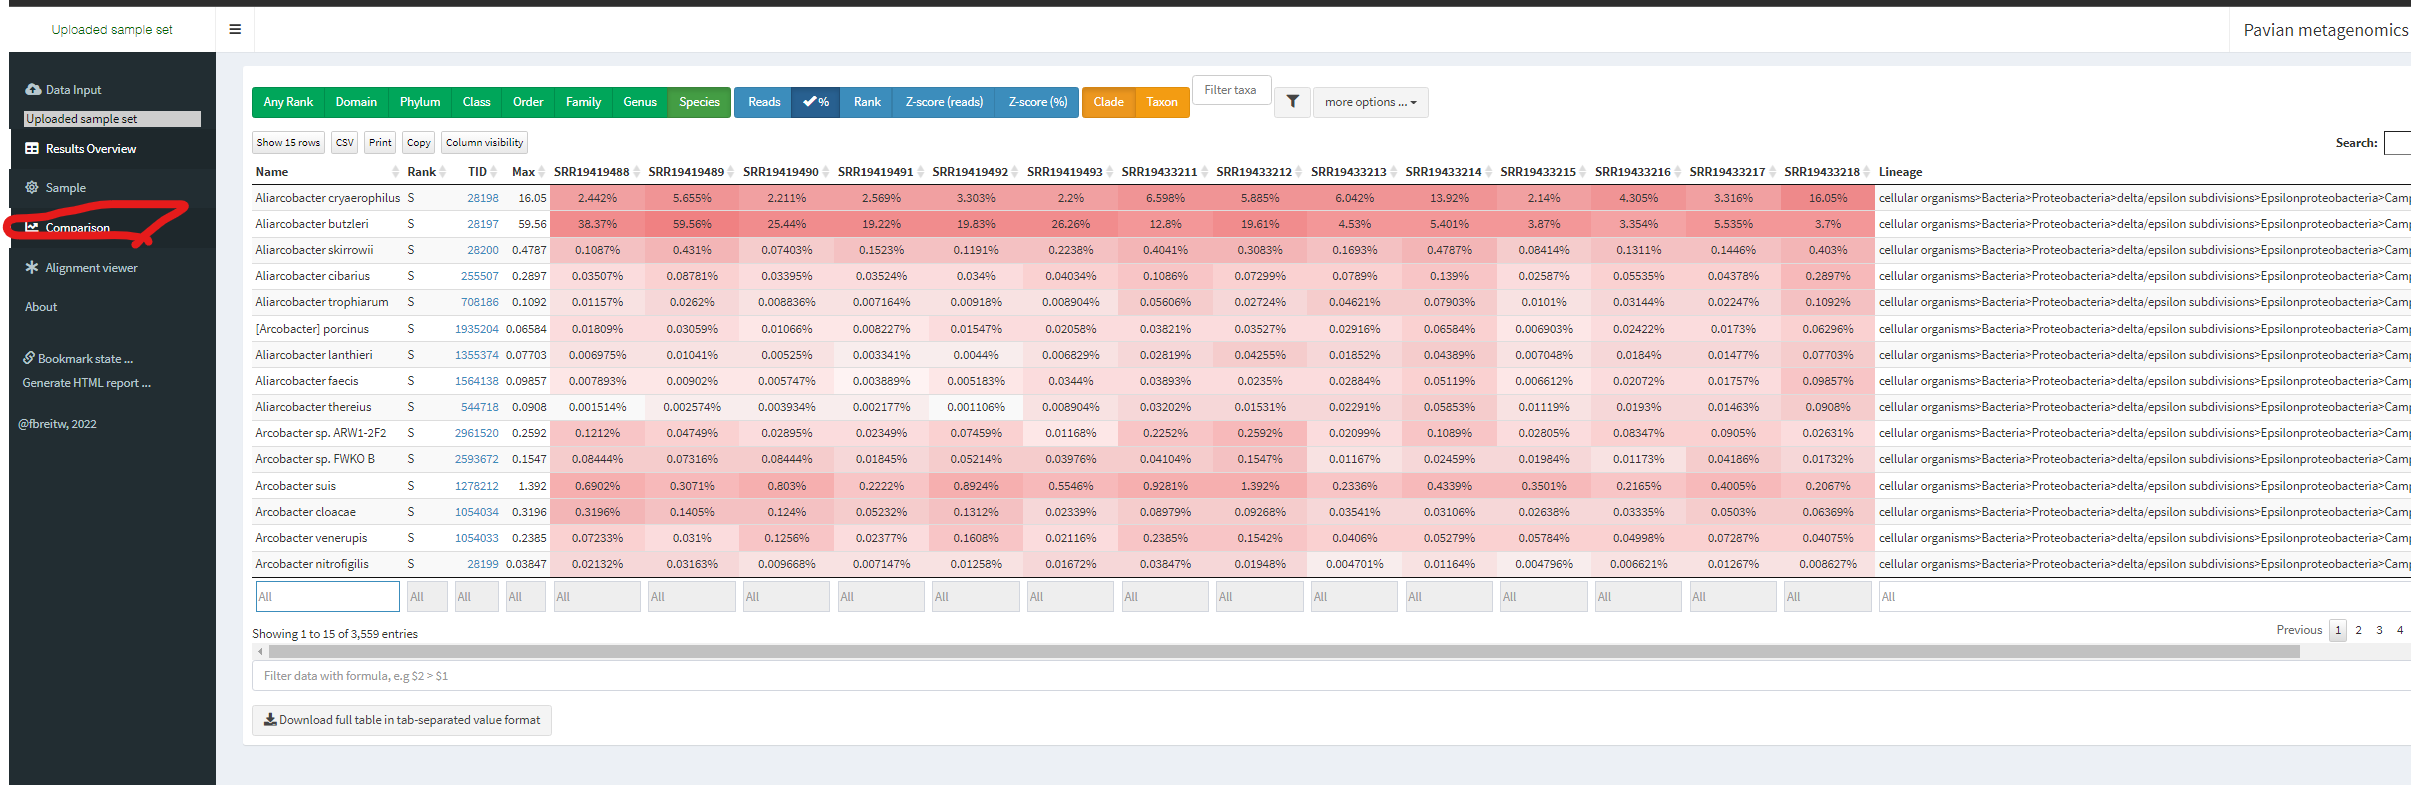
By click Comparison on your left (RED circle), which sample includes the highest fraction of Severe acute respiratory syndrome-related coronavirus
Please use filter in the bottom of table and use % option in top of table.