Hybrid Genome assembly Spades
cd /data/gpfs/assoc/bch709-1/<YOURID>/Genome_assembly/

mkdir Spades_Illumina_Pacbio
cd Spades_Illumina_Pacbio
conda activate genomeassembly
Submit below job
#!/bin/bash
#SBATCH --job-name=Spades
#SBATCH --cpus-per-task=16
#SBATCH --time=12:00:00
#SBATCH --mem=64g
#SBATCH --account=cpu-s2-bch709-1
#SBATCH --partition=cpu-s2-core-0
#SBATCH --mail-type=all
#SBATCH --mail-user=<YOUR ID>@unr.edu
#SBATCH -o Spades.out # STDOUT
#SBATCH -e Spades.err # STDERR
zcat  <BCH709_Pacbio_01.fastq.gz> <BCH709_Pacbio_02.fastq.gz> >> merged_pacbio.fastq
spades.py -k 21,33,55,77 --careful -1 <trim_galore output> -2 <trim_galore output> --pacbio merged_pacbio.fastq -o spades_output --memory 64 --threads 16
De novo assembly
Illumina only assembly
/data/gpfs/assoc/bch709-1/<YOURID>/Genome_assembly/Illumina/Spades/spades_output/scaffolds.fasta
PacBio with Illumina assembly
/data/gpfs/assoc/bch709-1/<YOURID>/Genome_assembly/pacbio/spades_output/scaffolds.fasta
Download below files to your desktop
Think about how to avoid overwrite.
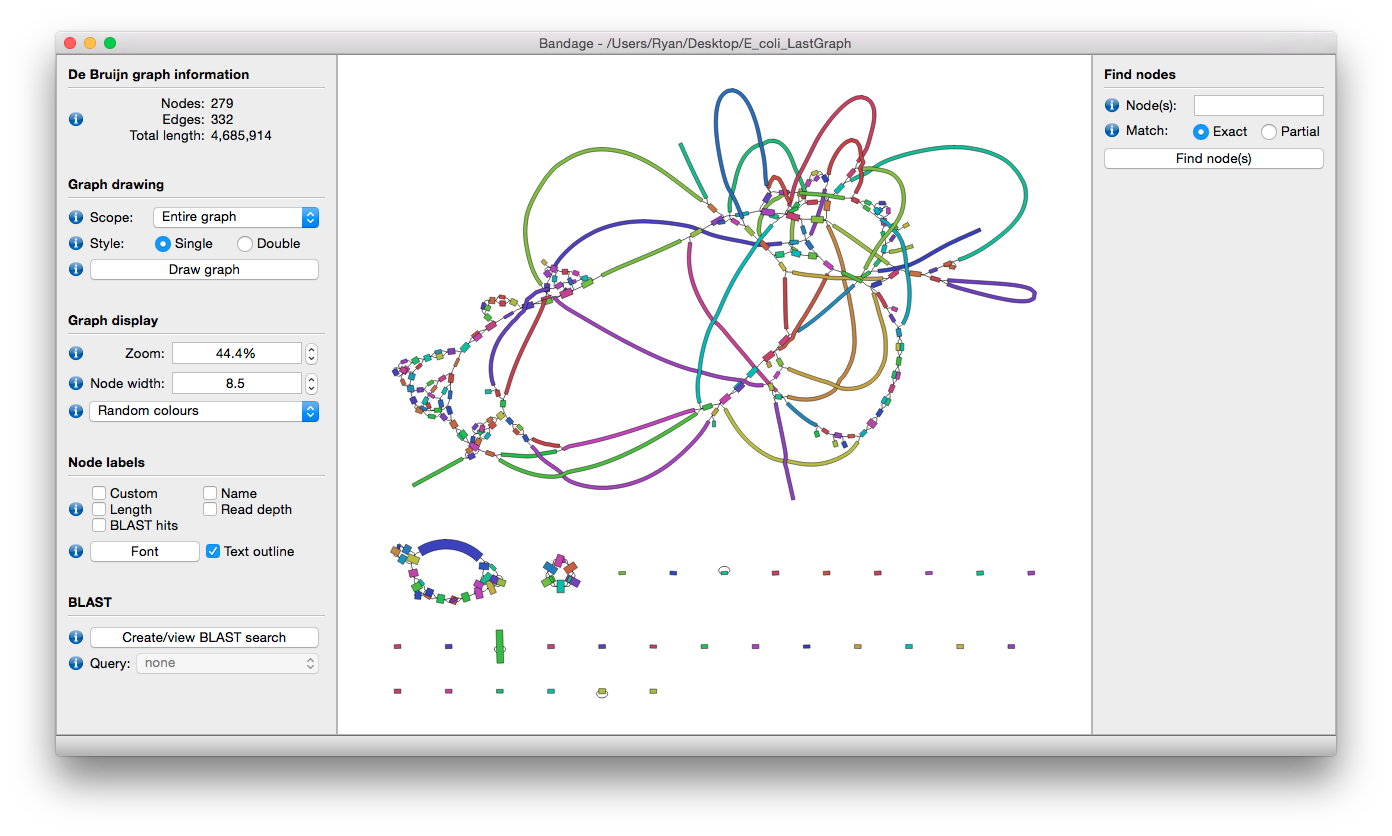
/data/gpfs/assoc/bch709-1/<YOURID>/Genome_assembly/Illumina/Spades/spades_output/assembly_graph.fastg

/data/gpfs/assoc/bch709-1/<YOURID>/Genome_assembly/pacbio/spades_output/assembly_graph.fastg
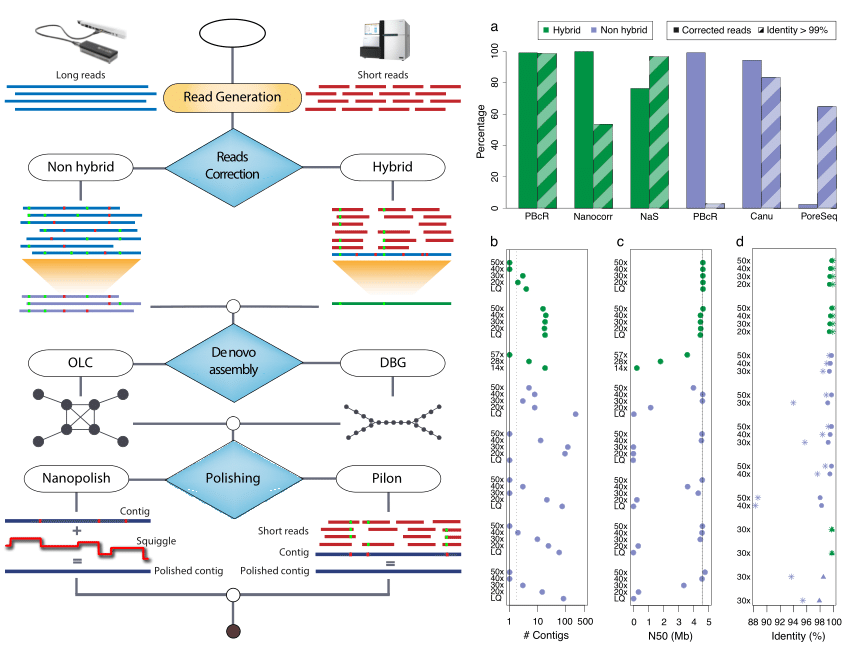
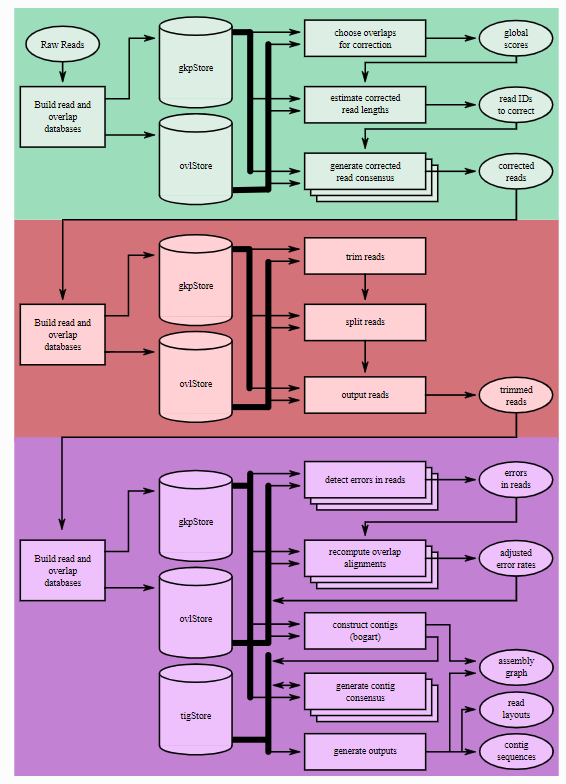
Canu
Canu (Koren et al. 2017) is a fork of the celera assembler and improves upon the earlier PBcR pipeline into a single, comprehensive assembler. Highly repetitive k-mers, which are abundant in all the reads, can be non-informative. Hence term frequency, inverse document frequency (tf-idf), a weighting statistic was added to MinHashing, giving weightage to non-repetitive k-mers as minimum values in the MinHash sketches, and sensitivity has been demonstrated to reach up to 89% without any parameter adjustment. By retrospectively inspecting the assembly graphs and also statistically filtering out repeat-induced overlaps, the chances of mis-assemblies are reduced.
Canu assembly
cd /data/gpfs/assoc/bch709-1/<YOURID>/Genome_assembly/PacBio
conda activate genomeassembly
Submit below job
#!/bin/bash
#SBATCH --job-name=Canu
#SBATCH --cpus-per-task=8
#SBATCH --time=2:00:00
#SBATCH --mem=24g
#SBATCH --account=cpu-s2-bch709-1
#SBATCH --partition=cpu-s2-core-0
#SBATCH --mail-type=all
#SBATCH --mail-user=<YOUR ID>@unr.edu
#SBATCH -o Canu.out # STDOUT
#SBATCH -e Canu.err # STDERR

canu -p canu -d canu_outdir genomeSize=11m -pacbio-raw <LOCATION_BCH709_Pacbio_1.fastq.gz> <LOCATION_BCH709_Pacbio_1.fastq.gz> corThreads=8 batMemory=64  ovbMemory=32 ovbThreads=8 corOutCoverage=32  ovsMemory=32-186 maxMemory=128 ovsThreads=8 oeaMemory=16  executiveMemory=32 gridOptions='--time=12-00:00:00 -p cpu-s2-core-0 -A cpu-s2-bch709-1 --mail-type=all --mail-user=<YOUR ID>@unr.edu'
Check the Quality of Genome Assembly
cd /data/gpfs/assoc/bch709-1/<YOURID>/Genome_assembly/
mkdir genomeassembly_results/
cd genomeassembly_results
Activate Your environment
conda activate genomeassembly
Copy Your Assembly Results
Spades
cp /data/gpfs/assoc/bch709-1/<YOURID>/Genome_assembly/Illumina/Spades/spades_output/scaffolds.fasta spades_illumina.fasta

cp /data/gpfs/assoc/bch709-1/<YOURID>/Genome_assembly/pacbio/spades_output/scaffolds.fasta spades_pacbio_illumina.fasta
Canu
cp /data/gpfs/assoc/bch709-1/<YOURID>/Genome_assembly/PacBio/canu_outdir/canu.contigs.fasta canu.contigs.fasta
All results (If you don’t have it )
cp /data/gpfs/assoc/bch709-1/Course_material/2020/Genome_assembly/spades_illumina.fasta .
cp /data/gpfs/assoc/bch709-1/Course_material/2020/Genome_assembly/spades_pacbio_illumina.fasta .
cp /data/gpfs/assoc/bch709-1/Course_material/2020/Genome_assembly/canu.contigs.fasta .
Check Your Assembly Results
assembly-stats canu.contigs.fasta spades_pacbio_illumina.fasta spades_illumina.fasta
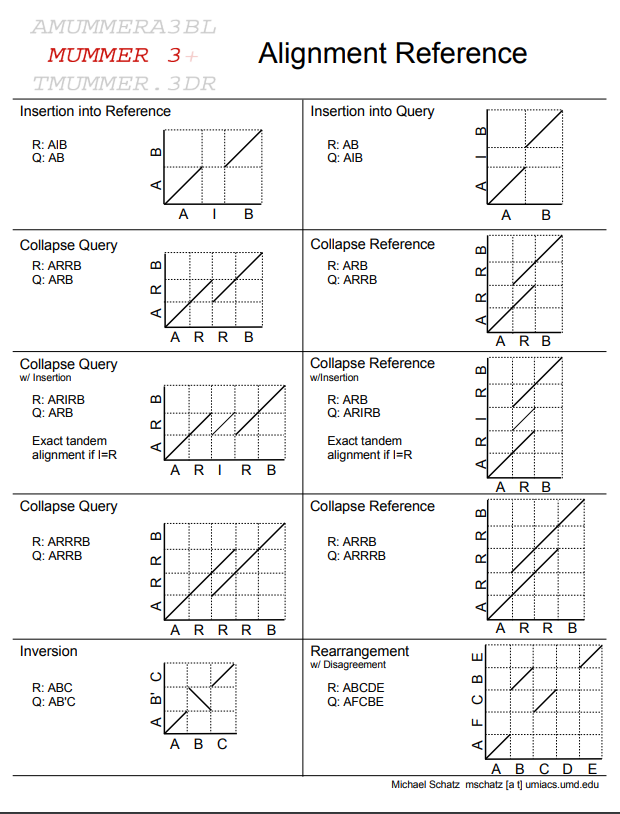
Compare Assemblies
Install Global Alignmnet Software
cd /data/gpfs/assoc/bch709-1/<YOURID>/Genome_assembly/
mkdir genomeassembly_alignment/
cd genomeassembly_alignment
conda activate genomeassembly
conda install  -c conda-forge -c anaconda -c bioconda mummer -y
Open source MUMmer 3.0 is described in “Versatile and open software for comparing large genomes.” S. Kurtz, A. Phillippy, A.L. Delcher, M. Smoot, M. Shumway, C. Antonescu, and S.L. Salzberg, Genome Biology (2004), 5:R12.
MUMmer 2.1, NUCmer, and PROmer are described in “Fast Algorithms for Large-scale Genome Alignment and Comparision.” A.L. Delcher, A. Phillippy, J. Carlton, and S.L. Salzberg, Nucleic Acids Research (2002), Vol. 30, No. 11 2478-2483.
MUMmer 1.0 is described in “Alignment of Whole Genomes.” A.L. Delcher, S. Kasif, R.D. Fleischmann, J. Peterson, O. White, and S.L. Salzberg, Nucleic Acids Research, 27:11 (1999), 2369-2376.
Space efficent suffix trees are described in “Reducing the Space Requirement of Suffix Trees.” S. Kurtz, Software-Practice and Experience, 29(13): 1149-1171, 1999.
Run Genome Wide Global Alignmnet Software
#!/bin/bash
#SBATCH --job-name=nucmer
#SBATCH --cpus-per-task=2
#SBATCH --time=15:00
#SBATCH --mem=10g
#SBATCH --mail-type=all
#SBATCH --mail-user=<YOURID>@unr.edu
#SBATCH -o nucmer.out # STDOUT
#SBATCH -e nucmer.err # STDERR
#SBATCH --account=cpu-s2-bch709-1
#SBATCH --partition=cpu-s2-core-0


nucmer  --coords -p canu_pacbio_Spades_illumina <canu.contigs> <spades_illumina_scaffold_file>


nucmer  --coords -p canu_pacbio_Spades_illumina_pacbio <canu.contigs> <Spades_illumina_pacbio_scaffold_file>
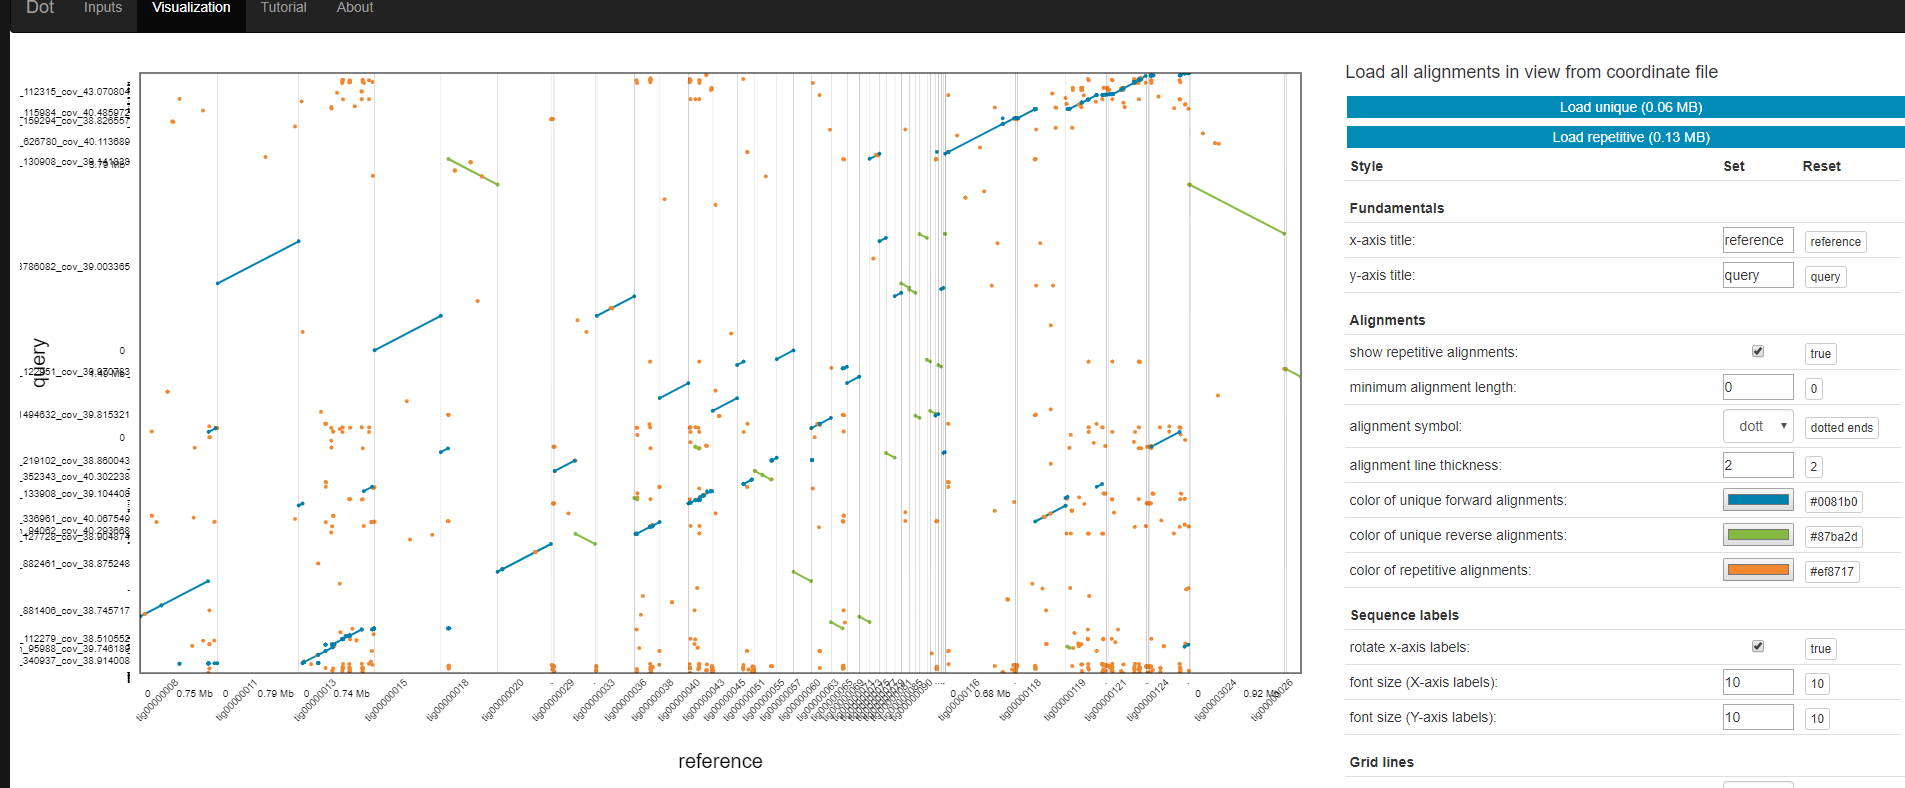
Dot
Dot is an interactive dot plot viewer for genome-genome alignments.
Dot is publicly available here: https://dnanexus.github.io/dot And can also be used locally by cloning this repository and simply opening the index.html file in a web browser.
After aligning genome assemblies or finished genomes against each other with MUMmer’s nucmer, the alignments can be visualized with Dot. Instead of generating static dot plot images on the command-line, Dot lets you interact with the alignments by zooming in and investigating regions in detail.
To prepare a .delta file (nucmer output) for Dot, run this python (3.6) script first: https://dnanexus.github.io/dot/DotPrep.py
The DotPrep.py script will apply a unique anchor filtering algorithm to mark alignments as unique or repetitive. This algorithm analyzes all of the alignments, and it needs to see unfiltered data to determine which alignments are repetitive, so make sure to run nucmer without any filtering options and without running delta-filter on the .delta file before passing it into DotPrep.py.
wget https://dnanexus.github.io/dot/DotPrep.py

chmod 775 DotPrep.py
nano DotPrep.sh
#!/bin/bash
#SBATCH --job-name=dot
#SBATCH --cpus-per-task=2
#SBATCH --time=15:00
#SBATCH --mem=10g
#SBATCH --mail-type=all
#SBATCH --mail-user=wyim@unr.edu
#SBATCH -o nucmer.out # STDOUT
#SBATCH -e nucmer.err # STDERR
#SBATCH --account=cpu-s6-test-0
#SBATCH --partition=cpu-s6-test-0
python DotPrep.py  --delta canu_pacbio_Spades_illumina.delta --out  canu_pacbio_Spades_illumina
python DotPrep.py  --delta canu_pacbio_Spades_illumina_pacbio.delta  --out canu_pacbio_Spades_illumina_pacbio
The output of DotPrep.py includes the *.coords and *.coords.idx that should be used with Dot for visualization.
Visualization
- Transfer *.coords.* files
- Go to https://dnanexus.github.io/dot/
The output of DotPrep.py includes the *.coords and *.coords.idx that should be used with Dot for visualization.
Which one is the best?
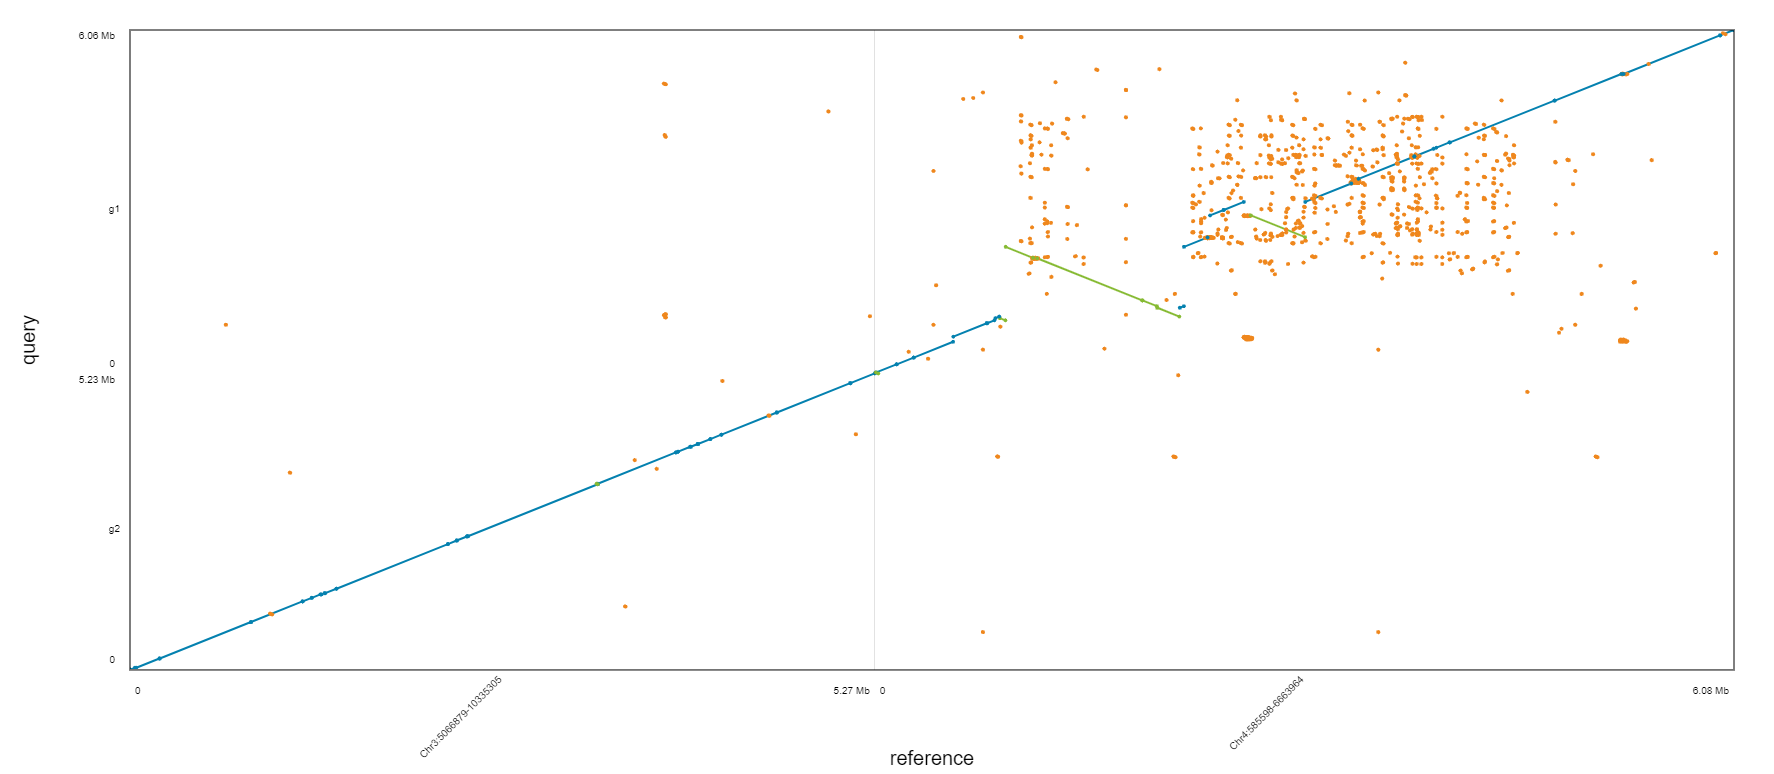
Assignment
Please upload three dot plot from assembly comparison.
-
Download below file. https://www.dropbox.com/s/xpnhj6j99dr1kum/Athaliana_subset_bch709-1.fa.
-
Align three fasta files (spades_illumina.fasta, spades_pacbio_illumina.fasta, canu.contigs.fasta) to downloaded Athaliana_subset_bch709-1.fa by nucmer independently.
-
Generate coords and coords.idx file using DotPrep.py.
-
Draw dot plot by DOT website.
-
Upload three dotplot to Webcanvas.
wget https://www.dropbox.com/s/xpnhj6j99dr1kum/Athaliana_subset_bch709-1.fa
BUSCO
BUSCO assessments are implemented in open-source software, with a large selection of lineage-specific sets of Benchmarking Universal Single-Copy Orthologs. These conserved orthologs are ideal candidates for large-scale phylogenomics studies, and the annotated BUSCO gene models built during genome assessments provide a comprehensive gene predictor training set for use as part of genome annotation pipelines.
https://busco.ezlab.org/
cd /data/gpfs/assoc/bch709-1/<YOURID>/Genome_assembly/
mkdir BUSCO
cd BUSCO
cp /data/gpfs/assoc/bch709-1/<YOURID>/Genome_assembly/genomeassembly_results/*.fasta .
 cp /data/gpfs/assoc/bch709-1/<YOURID>/Genome_assembly/Pilon/canu.illumina.fasta .

conda create -n busco4  python=3.6
conda activate busco4
conda install -c bioconda -c conda-forge busco=4.0.5 'multiqc<1.34' biopython
#!/bin/bash
#SBATCH --job-name=busco
#SBATCH --cpus-per-task=24
#SBATCH --time=12:00:00
#SBATCH --mem=20g
#SBATCH --mail-type=all
#SBATCH --mail-user=wyim@unr.edu
#SBATCH -o busco.out # STDOUT
#SBATCH -e busco.err # STDERR
#SBATCH -p cpu-s2-core-0
#SBATCH -A cpu-s2-bch709-1

export AUGUSTUS_CONFIG_PATH="~/miniconda3/envs/busco4/config/"

busco -l viridiplantae_odb10 --cpu 24 --in spades_illumina.fasta --out BUSCO_Illumina --mode genome  -f

busco -l viridiplantae_odb10 --cpu 24 --in spades_pacbio_illumina.fasta --out BUSCO_Illumina_Pacbio --mode genome  -f

busco -l viridiplantae_odb10 --cpu 24 --in canu.contigs.fasta   --out BUSCO_Pacbio --mode genome  -f

busco -l viridiplantae_odb10 --cpu 24 --in canu.illumina.fasta   --out BUSCO_Pacbio_Pilon --mode genome  -f

multiqc . -n assembly --exclude rsem --exclude gatk
BUSCO results
INFO:   Results:        C:10.8%[S:10.8%,D:0.0%],F:0.5%,M:88.7%,n:425

INFO:

        --------------------------------------------------
        |Results from dataset viridiplantae_odb10         |
        --------------------------------------------------
        |C:10.8%[S:10.8%,D:0.0%],F:0.5%,M:88.7%,n:425     |
        |46     Complete BUSCOs (C)                       |
        |46     Complete and single-copy BUSCOs (S)       |
        |0      Complete and duplicated BUSCOs (D)        |
        |2      Fragmented BUSCOs (F)                     |
        |377    Missing BUSCOs (M)                        |
        |425    Total BUSCO groups searched               |
        --------------------------------------------------
INFO:   BUSCO analysis done. Total running time: 123 seconds
mkdir BUSCO_result
cp BUSCO_*/*.txt BUSCO_result
generate_plot.py -wd BUSCO_result
Chromosome assembly
cd  /data/gpfs/assoc/bch709-1/<YOURID>/Genome_assembly/
mkdir /data/gpfs/assoc/bch709-1/<YOURID>/Genome_assembly/hic   ## will go to genome assembly folder adn make hic folder
cd !$
How can we improve these genome assemblies?
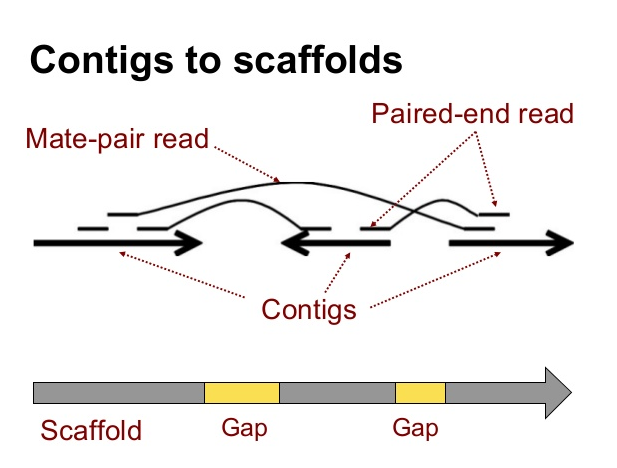
Mate Pair Sequencing
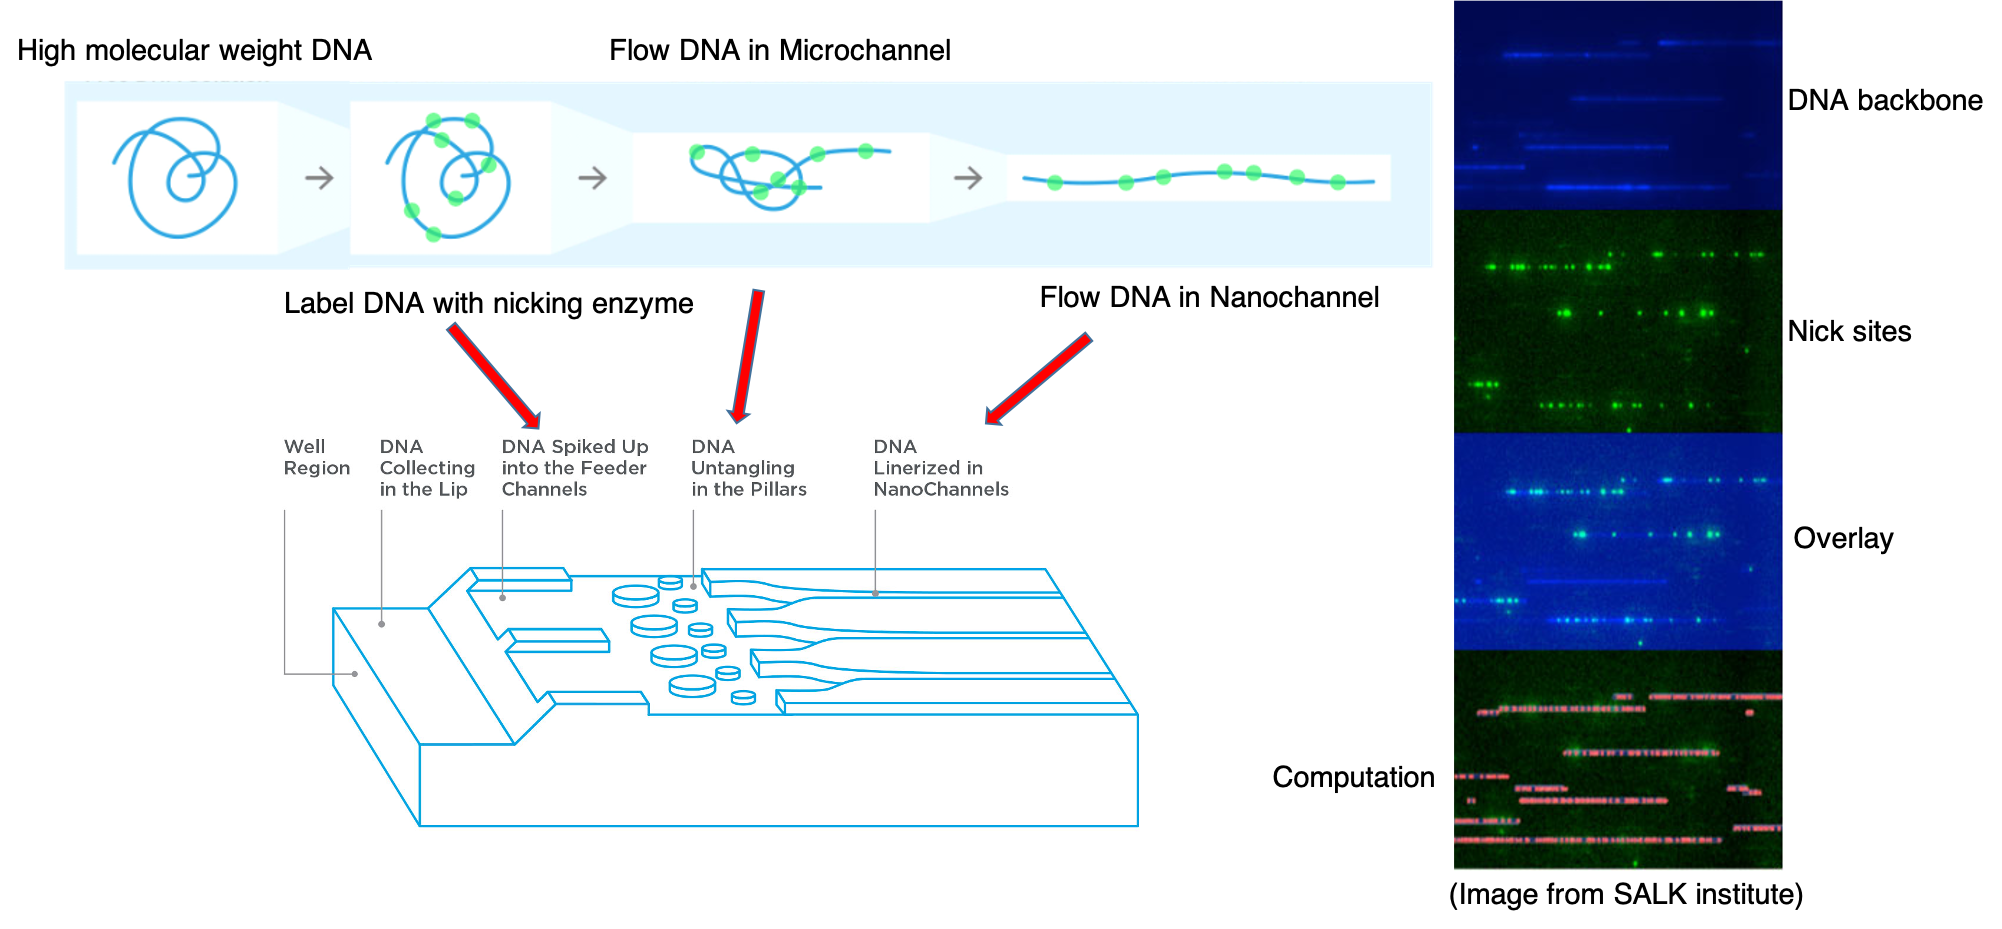
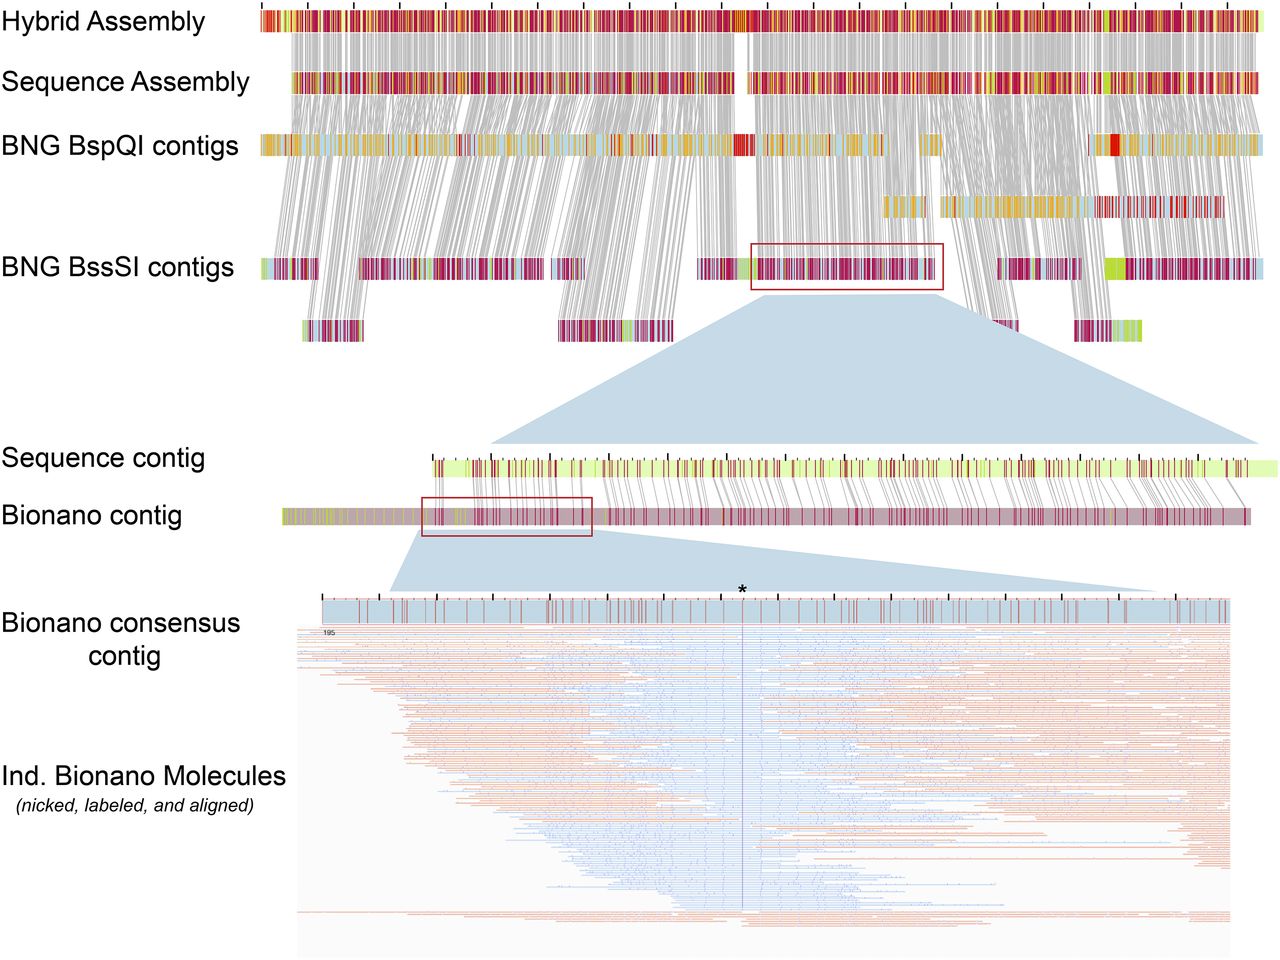
BioNano Optical Mapping
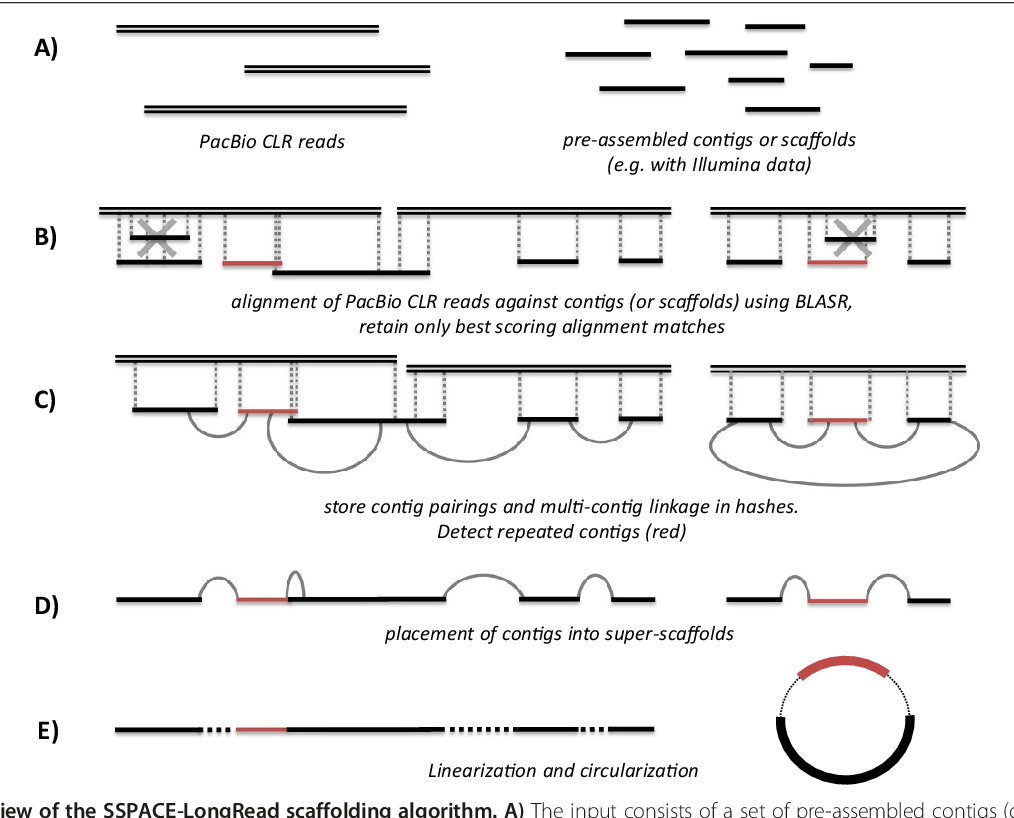
Long Read Scaffolding
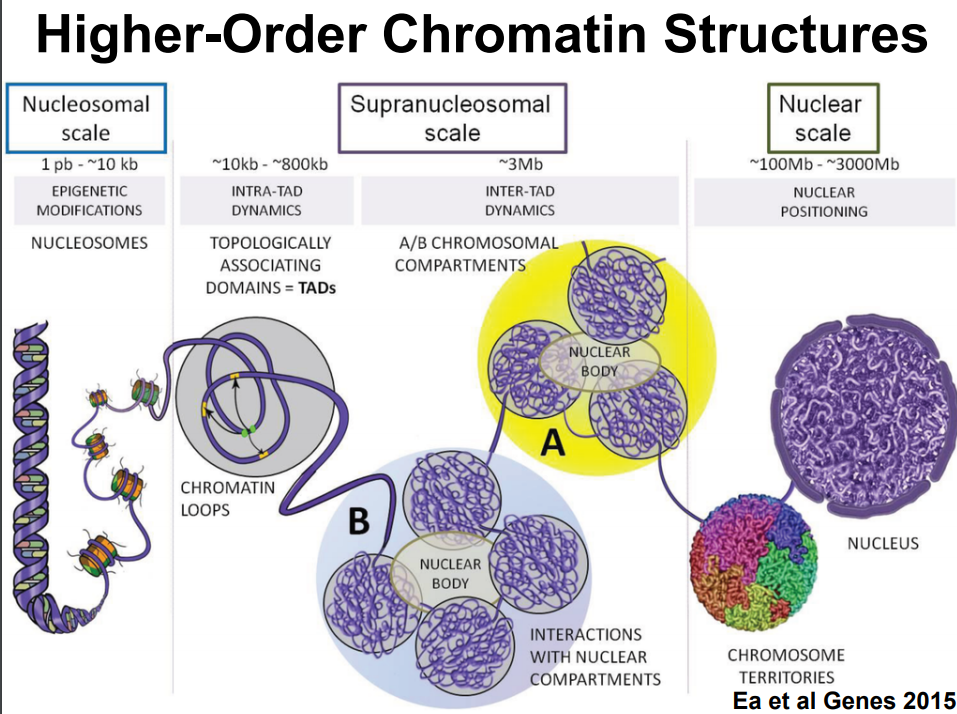
Chromosome Conformation Scaffolding
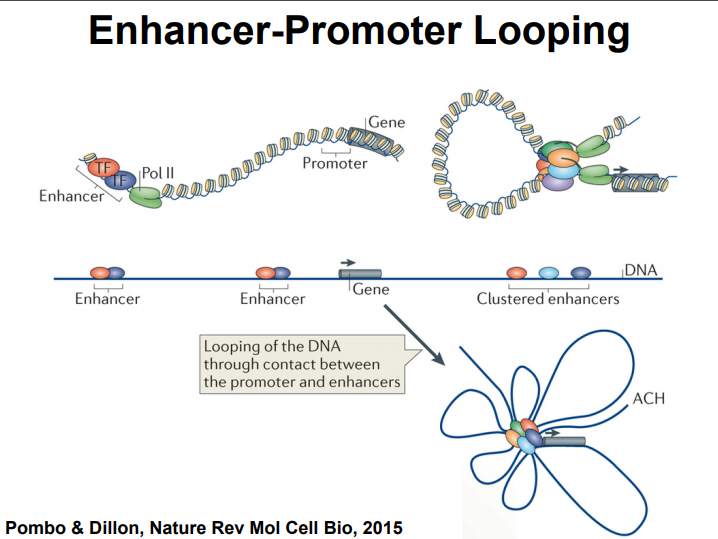
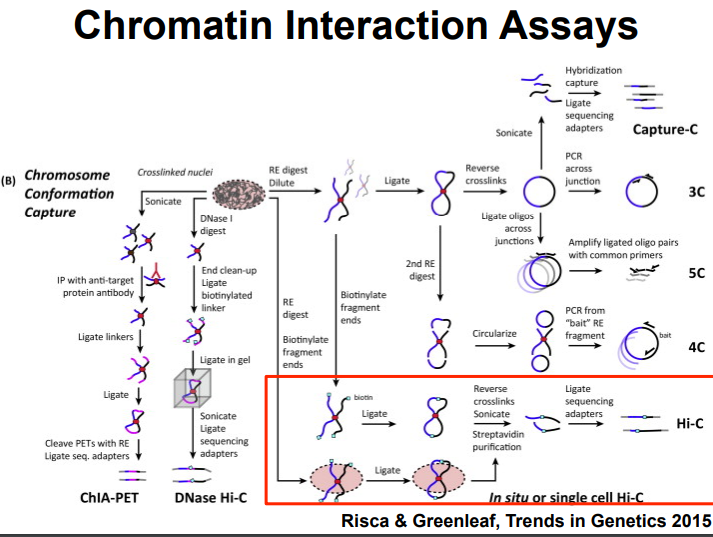
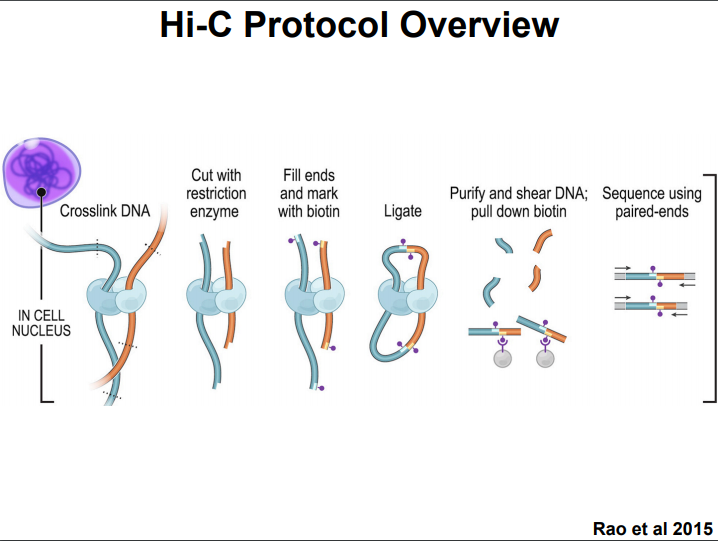
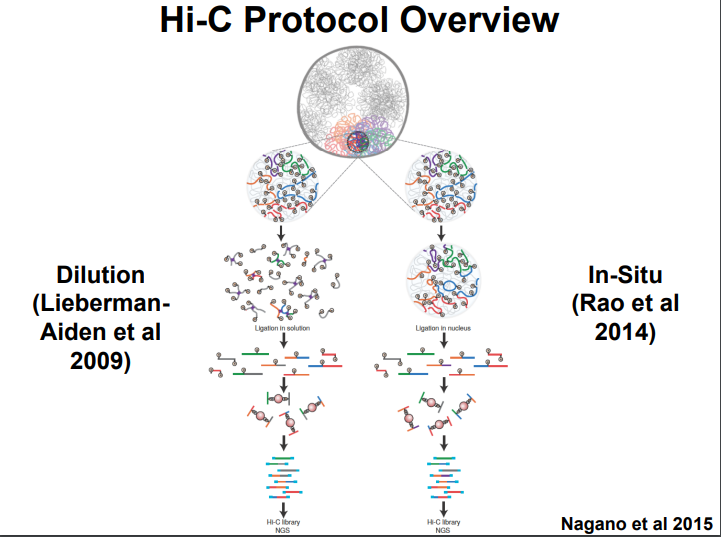
HiC for Genome Assembly
Chromosome assembly
mkdir /data/gpfs/assoc/bch709-1/<YOURID>/Genome_assembly/Hic
cd !$
HiC
conda create -n hic

conda activate hic

conda install -c r -c conda-forge -c anaconda -c bioconda samtools bedtools matplotlib numpy scipy bwa openssl=1.0 -y
canu.illumina.fasta
The input of HiC is the output of Pilon. If you don’t have it please do Pilon first.
File preparation
cp /data/gpfs/assoc/bch709-1/Course_material/2020/Genome_assembly/hic_r{1,2}.fastq.gz .

cp /data/gpfs/assoc/bch709-1/Course_material/2020/Genome_assembly/allhic.zip .
ALLHiC
Phasing and scaffolding polyploid genomes based on Hi-C data
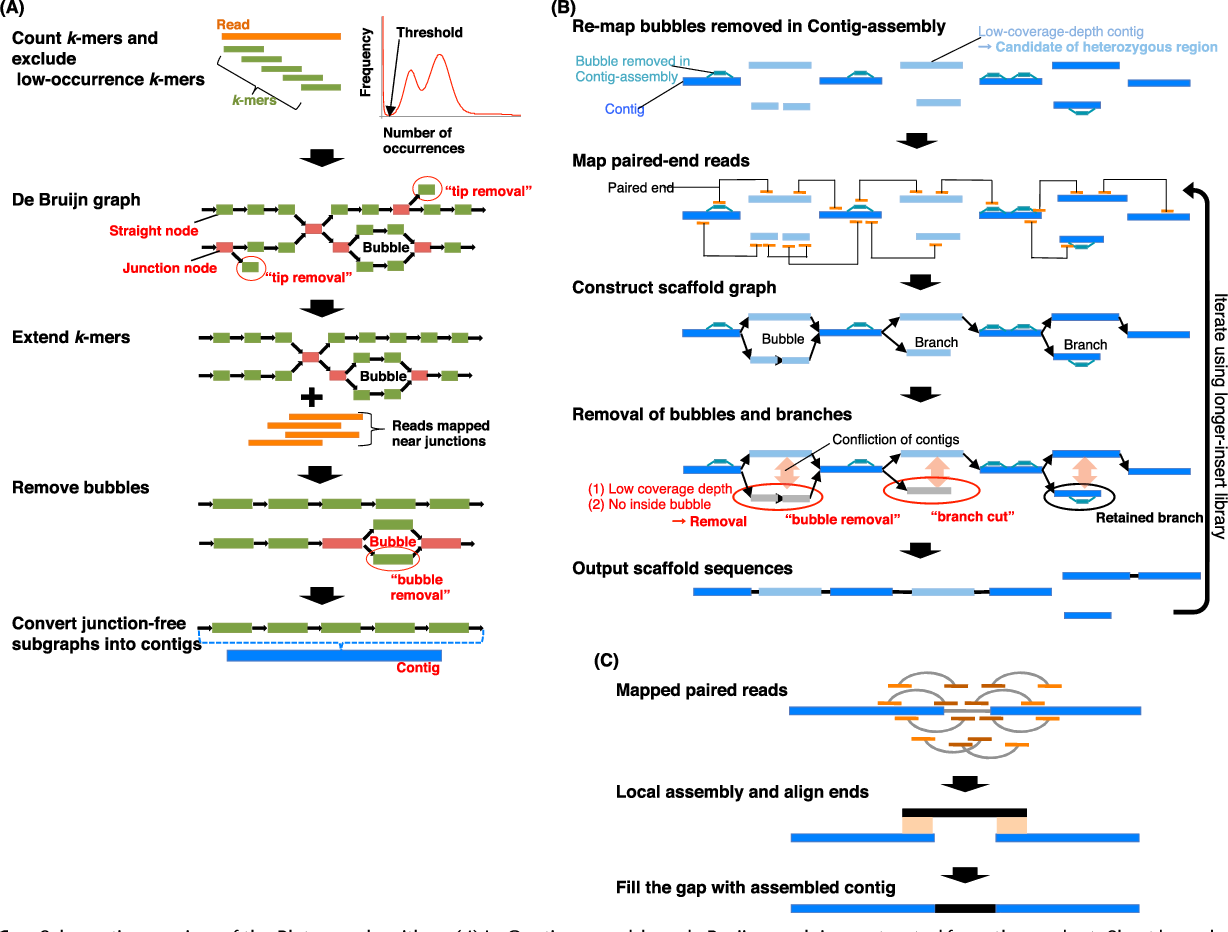
Introduction
The major problem of scaffolding polyploid genome is that Hi-C signals are frequently detected between allelic haplotypes and any existing stat of art Hi-C scaffolding program links the allelic haplotypes together. To solve the problem, we developed a new Hi-C scaffolding pipeline, called ALLHIC, specifically tailored to the polyploid genomes. ALLHIC pipeline contains a total of 5 steps: prune, partition, rescue, optimize and build.
Overview of ALLHiC

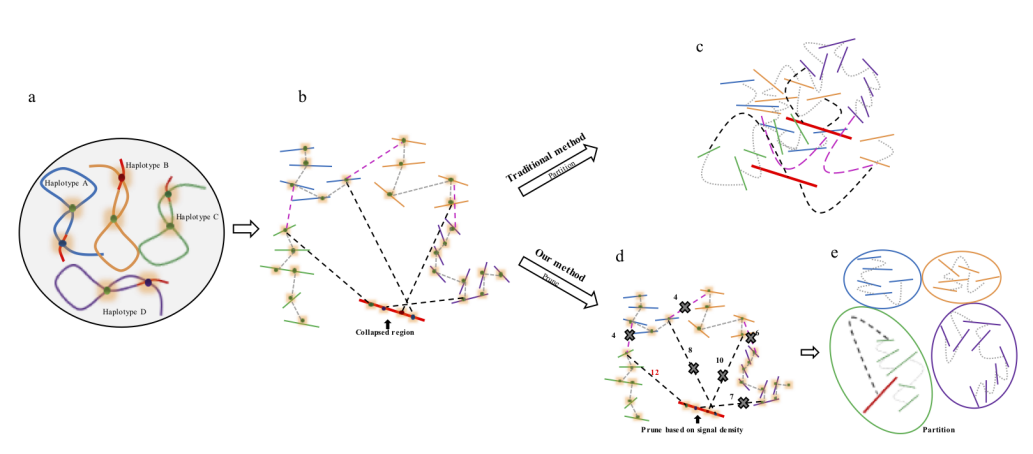
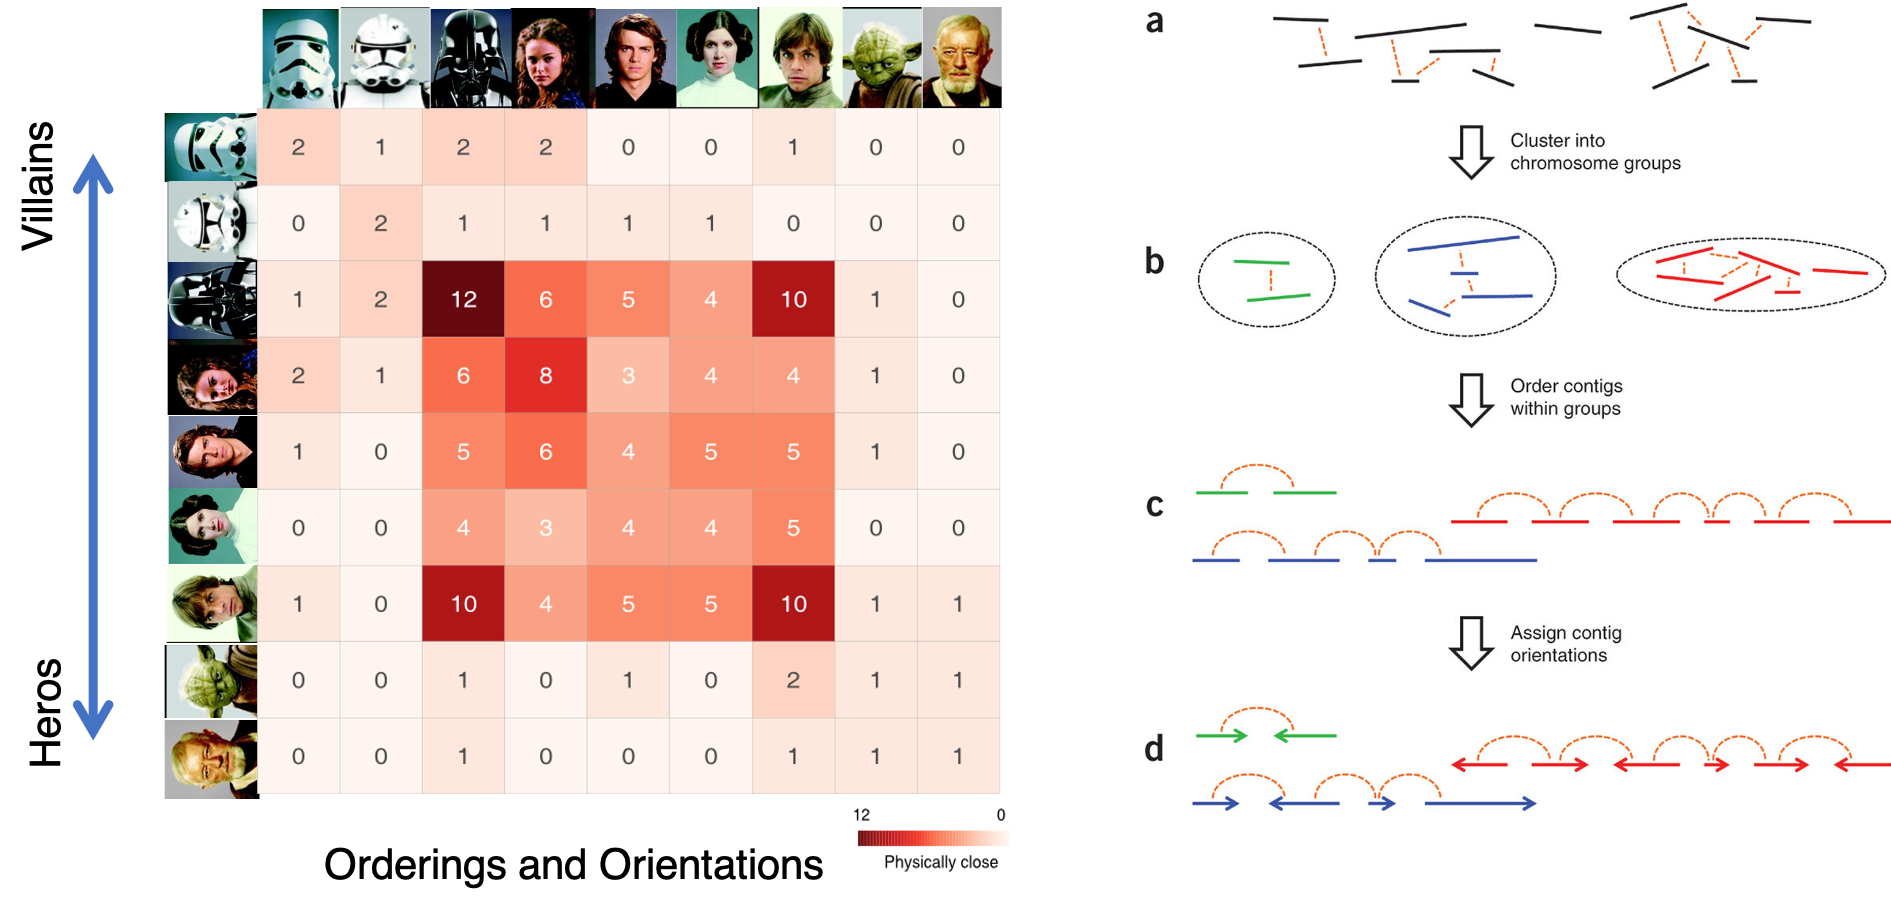
Figure 1. Overview of major steps in ALLHiC algorithm. The newly released ALLHiC pipeline contains a total of 5 functions: prune, partition, rescue, optimize and build. Briefly, the prune step removes the inter-allelic links so that the homologous chromosomes are more easily separated individually. The partition function takes pruned bam file as input and clusters the linked contigs based on the linkage suggested by Hi-C, presumably along the same homologous chromosome in a preset number of partitions. The rescue function searches for contigs that are not involved in partition step from original un-pruned bam files and assigned them to specific clusters according Hi-C signal density. The optimize step takes each partition, and optimize the ordering and orientations for all the contigs. Finally, the build step reconstructs each chromosome by concatenating the contigs, adding gaps between the contigs and generating the final genome release in FASTA format.
Explanation of Prune
Prune function will firstly allow us to detect allelic contigs, which can be achieved by identifying syntenic genes based on a well-assembled close related species or an assembled monoploid genome. Signals (normalized Hi-C reads) between allelic contigs are removed from the input BAM files. In polyploid genome assembly, haplotypes that share high similarity are likely to be collapsed. Signals between the collapsed regions and nearby phased haplotypes result in chimeric scaffolds. In the prune step, only the best linkage between collapsed coting and phased contig is retained.
 Figure 2. Description of Hi-C scaffolding problem in polyploid genome and application of prune approach for haplotype phasing. (a) a schematic diagram of auto-tetraploid genome. Four homologous chromosomes are indicated as different colors (blue, orange, green and purple, respectively). Red regions in the chromosomes indicate sequences with high similarity. (b) Detection of Hi-C signals in the auto-tetraploid genome. Black dash lines indicate Hi-C signals between collapsed regions and un-collpased contigs. Pink dash lines indicate inter-haplotype Hi-C links and grey dash lines indicate intra-haplotype Hi-C links. During assembly, red regions will be collapsed due to high sequence similarity; while, other regions will be separated into different contigs if they have abundant variations. Since the collapsed regions are physically related with contigs from different haplotypes, Hi-C signals will be detected between collapsed regions with all other un-collapsed contigs. (c) Traditional Hi-C scaffolding methods will detect signals among contigs from different haplotypes as well as collapsed regions and cluster all the sequences together. (d) Prune Hi-C signals: 1- remove signals between allelic regions; 2- only retain the strongest signals between collapsed regions and un-collapsed contigs. (e) Partition based on pruned Hi-C information. Contigs are ideally phased into different groups based on prune results.
Citations
Zhang, X. Zhang, S. Zhao, Q. Ming, R. Tang, H. Assembly of allele-aware, chromosomal scale autopolyploid genomes based on Hi-C data. Nature Plants, doi:10.1038/s41477-019-0487-8 (2019).
Zhang, J. Zhang, X. Tang, H. Zhang, Q. et al. Allele-defined genome of the autopolyploid sugarcane Saccharum spontaneum L. Nature Genetics, doi:10.1038/s41588-018-0237-2 (2018).
Algorithm demo
Solving scaffold ordering and orientation (OO) in general is NP-hard. ALLMAPS converts the problem into Traveling Salesman Problem (TSP) and refines scaffold OO using Genetic Algorithm. For rough idea, a ‘live’ demo of the scaffold OO on yellow catfish chromosome 1 can be viewed in the animation below.

Traveling Salesman Problem