Human DEG
Activate environment
conda activate BCH709_RNASeq
Remove folder
rm -rf /data/gpfs/assoc/bch709-4/${USER}/rnaseq_assembly
Copy human featurecount results
cp /data/gpfs/assoc/bch709-4/Course_materials/human/human_featurecount.txt  /data/gpfs/assoc/bch709-4/${USER}/human/readcount/
cd /data/gpfs/assoc/bch709-4/${USER}/human/readcount/
Clean sample name
cut -f1,7-  human_featurecount.txt |  egrep -v "#" | sed 's/\Aligned\.sortedByCoord\.out\.bam//g; s/\.bam//g' > human_featurecount_only.cnt
cut -f1,6-  human_featurecount.txt |  egrep -v "#" | sed 's/\Aligned\.sortedByCoord\.out\.bam//g; s/\.bam//g' > human_featurecount_length.cnt
Copy read count to DEG folder
cp /data/gpfs/assoc/bch709-4/${USER}/human/readcount/human_featurecount_* /data/gpfs/assoc/bch709-4/${USER}/human/DEG
Go to DEG folder
cd /data/gpfs/assoc/bch709-4/${USER}/human/DEG
sample files
cp /data/gpfs/assoc/bch709-4/Course_materials/human/human_sample_association /data/gpfs/assoc/bch709-4/${USER}/human/DEG

cp /data/gpfs/assoc/bch709-4/Course_materials/human/human_contrast /data/gpfs/assoc/bch709-4/${USER}/human/DEG

cd /data/gpfs/assoc/bch709-4/${USER}/human/DEG
PtR (Quality Check Your Samples and Biological Replicates)
Once you’ve performed transcript quantification for each of your biological replicates, it’s good to examine the data to ensure that your biological replicates are well correlated, and also to investigate relationships among your samples. If there are any obvious discrepancies among your sample and replicate relationships such as due to accidental mis-labeling of sample replicates, or strong outliers or batch effects, you’ll want to identify them before proceeding to subsequent data analyses (such as differential expression).
cd /data/gpfs/assoc/bch709-4/${USER}/human/DEG
PtR  --matrix human_featurecount_only.cnt  --samples human_sample_association --CPM  --log2 --min_rowSums 10   --sample_cor_matrix --compare_replicates
PtR download on local
scp ${USER}@pronghorn.rc.unr.edu:/data/gpfs/assoc/bch709-4/${USER}/human/DEG/*.pdf .
If this is not working on local Mac
echo "setopt nonomatch" >> ~/.zshrc
DEG analysis on Pronghorn
cd /data/gpfs/assoc/bch709-4/${USER}/human/DEG

run_DE_analysis.pl --matrix human_featurecount_only.cnt --method DESeq2 --samples_file human_sample_association --contrasts human_contrast --output human_rnaseq
DEG analysis results
ls human_rnaseq
TPM/FPKM calculation
python /data/gpfs/assoc/bch709-4/Course_materials/script/tpm_raw_exp_calculator.py -count human_featurecount_length.cnt
TPM and FPKM calculation output
human_featurecount_length.cnt.fpkm.xls
human_featurecount_length.cnt.fpkm.tab
human_featurecount_length.cnt.tpm.xls
human_featurecount_length.cnt.tpm.tab
DEG subset
cd /data/gpfs/assoc/bch709-4/${USER}/human/DEG/human_rnaseq
analyze_diff_expr.pl --samples /data/gpfs/assoc/bch709-4/${USER}/human/DEG/human_sample_association  --matrix /data/gpfs/assoc/bch709-4/${USER}/human/DEG/human_featurecount_length.cnt.tpm.tab -P 0.01 -C 2 --output human_RNASEQ_P001_C2
analyze_diff_expr.pl --samples /data/gpfs/assoc/bch709-4/${USER}/human/DEG/human_sample_association  --matrix /data/gpfs/assoc/bch709-4/${USER}/human/DEG/human_featurecount_length.cnt.tpm.tab -P 0.01 -C 1 --output human_RNASEQ_P001_C1
DEG download
scp -r [YOURID]@pronghorn.rc.unr.edu:/data/gpfs/assoc/bch709-4/[YOURID]/human/DEG/ .


# Mouse DEG
## Activate environment
```bash
conda activate BCH709_RNASeq
Copy Mouse featurecount results
cp /data/gpfs/assoc/bch709-4/Course_materials/mouse/mouse_featurecount.txt  /data/gpfs/assoc/bch709-4/${USER}/mouse/readcount/
cd /data/gpfs/assoc/bch709-4/${USER}/mouse/readcount/
Clean sample name
cut -f1,7-  mouse_featurecount.txt |  egrep -v "#" | sed 's/\Aligned\.sortedByCoord\.out\.bam//g; s/\.bam//g' >> mouse_featurecount_only.cnt
cut -f1,6-  mouse_featurecount.txt |  egrep -v "#" | sed 's/\Aligned\.sortedByCoord\.out\.bam//g; s/\.bam//g' >> mouse_featurecount_length.cnt
Copy read count to DEG folder
cp /data/gpfs/assoc/bch709-4/${USER}/mouse/readcount/mouse_featurecount_* /data/gpfs/assoc/bch709-4/${USER}/mouse/DEG
Go to DEG folder
cd /data/gpfs/assoc/bch709-4/${USER}/mouse/DEG
sample files
cp /data/gpfs/assoc/bch709-4/Course_materials/mouse/mouse_sample_association /data/gpfs/assoc/bch709-4/${USER}/mouse/DEG

cp /data/gpfs/assoc/bch709-4/Course_materials/mouse/mouse_contrast /data/gpfs/assoc/bch709-4/${USER}/mouse/DEG

cd /data/gpfs/assoc/bch709-4/${USER}/mouse/DEG
PtR (Quality Check Your Samples and Biological Replicates)
cd /data/gpfs/assoc/bch709-4/${USER}/mouse/DEG
PtR  --matrix mouse_featurecount_only.cnt  --samples mouse_sample_association --CPM  --log2 --min_rowSums 10   --sample_cor_matrix --compare_replicates
PtR download on local
scp [YOURID]@pronghorn.rc.unr.edu:/data/gpfs/assoc/bch709-4/[YOURID]/mouse/DEG/*.pdf .
If this is not working on local Mac
echo "setopt nonomatch" >> ~/.zshrc
DEG analysis on Pronghorn
cd /data/gpfs/assoc/bch709-4/${USER}/mouse/DEG

run_DE_analysis.pl --matrix mouse_featurecount_only.cnt --method DESeq2 --samples_file mouse_sample_association --contrasts mouse_contrast --output mouse_rnaseq
DEG analysis results
ls mouse_rnaseq
TPM/FPKM calculation
python /data/gpfs/assoc/bch709-4/Course_materials/script/tpm_raw_exp_calculator.py -count mouse_featurecount_length.cnt
TPM and FPKM calculation output
mouse_featurecount_length.cnt.fpkm.xls
mouse_featurecount_length.cnt.fpkm.tab
mouse_featurecount_length.cnt.tpm.xls
mouse_featurecount_length.cnt.tpm.tab
DEG subset
cd /data/gpfs/assoc/bch709-4/${USER}/mouse/DEG/mouse_rnaseq
analyze_diff_expr.pl --samples /data/gpfs/assoc/bch709-4/${USER}/mouse/DEG/mouse_sample_association  --matrix /data/gpfs/assoc/bch709-4/${USER}/mouse/DEG/mouse_featurecount_length.cnt.tpm.tab -P 0.01 -C 2 --output mouse_RNASEQ_P001_C2
analyze_diff_expr.pl --samples /data/gpfs/assoc/bch709-4/${USER}/mouse/DEG/mouse_sample_association  --matrix /data/gpfs/assoc/bch709-4/${USER}/mouse/DEG/mouse_featurecount_length.cnt.tpm.tab -P 0.01 -C 1 --output mouse_RNASEQ_P001_C1
DEG download
scp -r [YOURID]@pronghorn.rc.unr.edu:/data/gpfs/assoc/bch709-4/wyim/mouse/DEG/ .
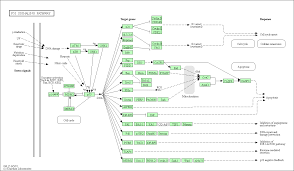
Functional analysis • GO
Gene enrichment analysis (Hypergeometric test) Gene set enrichment analysis (GSEA) Gene ontology / Reactome databases
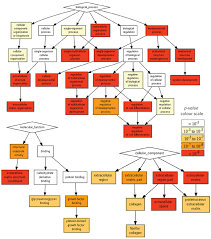
Gene Ontology
Gene Ontology project is a major bioinformatics initiative Gene ontology is an annotation system The project provides the controlled and consistent vocabulary of terms and gene product annotations, i.e. terms occur only once, and there is a dictionary of allowed words GO describes how gene products behave in a cellular context A consistent description of gene products attributes in terms of their associated biological processes, cellular components and molecular functions in a species-independent manner Each GO term consists of a unique alphanumerical identifier, a common name, synonyms (if applicable), and a definition Each term is assigned to one of the three ontologies Terms have a textual definition When a term has multiple meanings depending on species, the GO uses a “sensu” tag to differentiate among them (trichome differentiation (sensu Magnoliophyta)
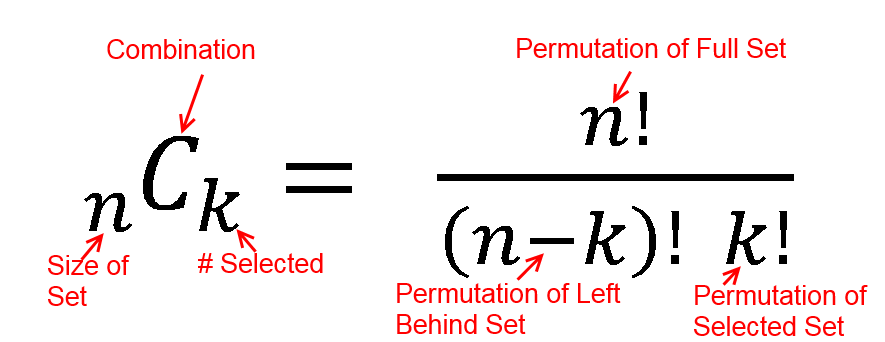
hypergeometric test
The hypergeometric distribution is the lesser-known cousin of the binomial distribution, which describes the probability of k successes in n draws with replacement. The hypergeometric distribution describes probabilities of drawing marbles from the jar without putting them back in the jar after each draw. The hypergeometric probability mass function is given by (using the original variable convention)

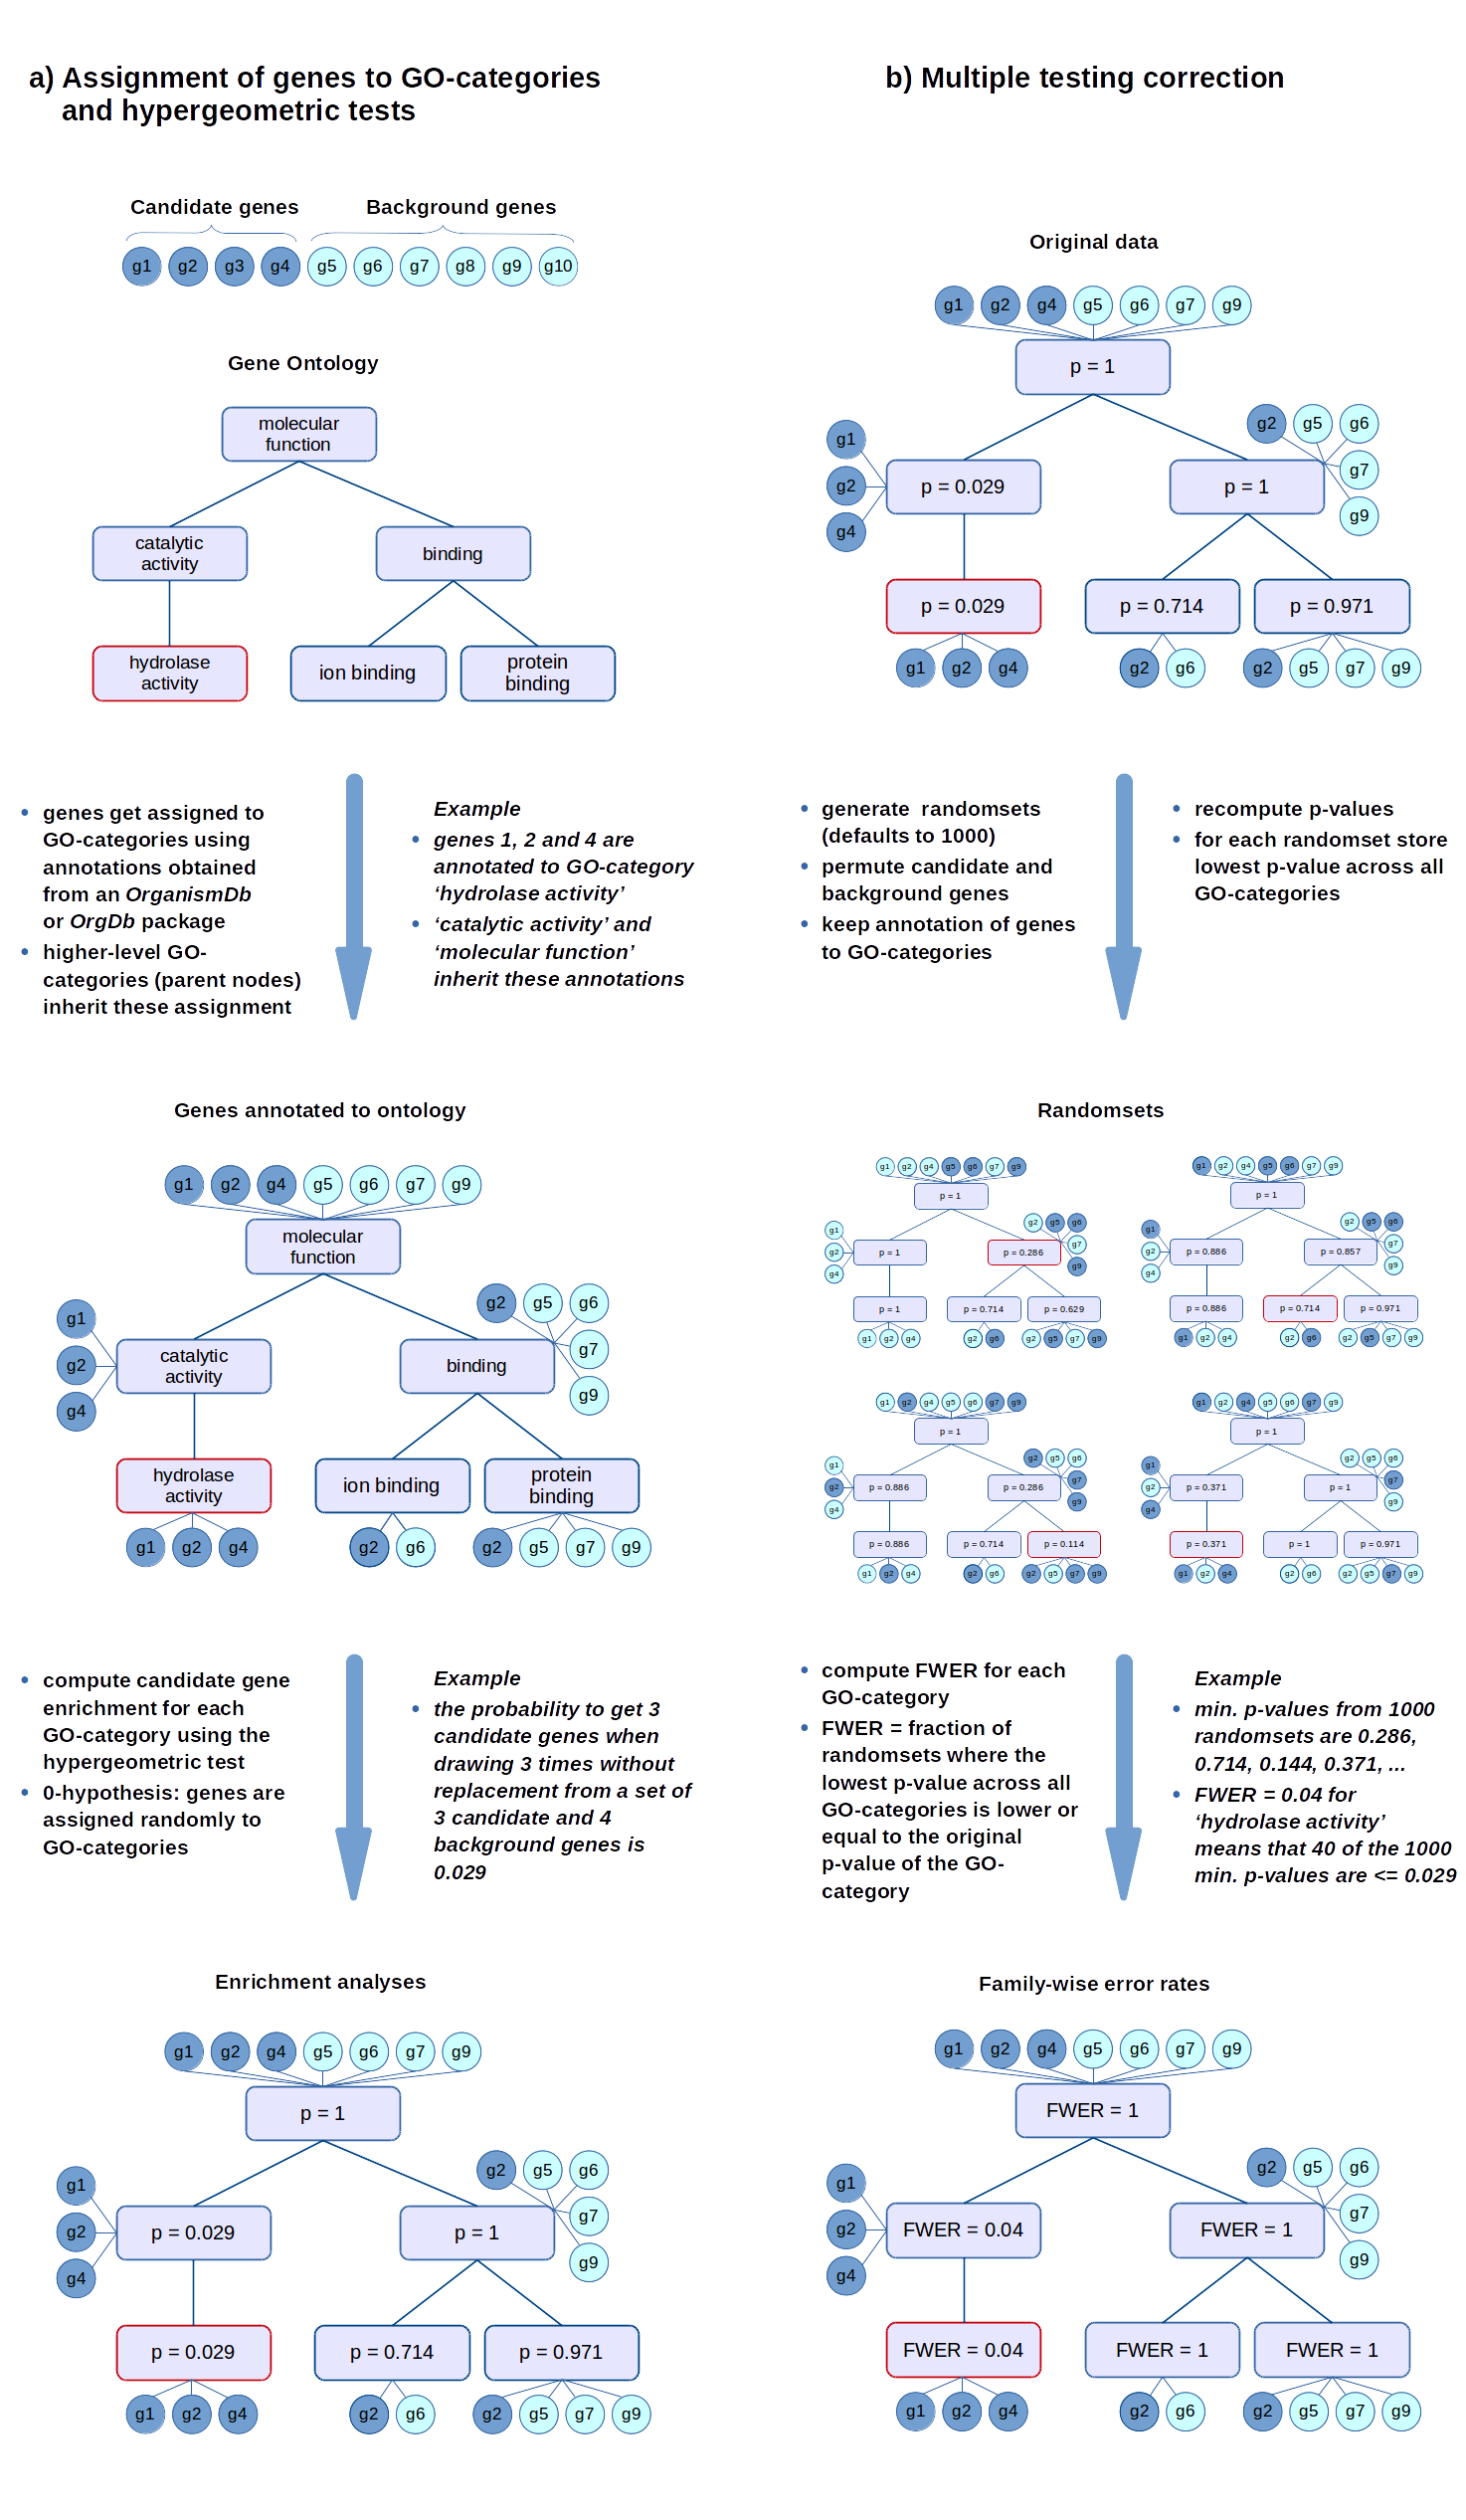
FWER
The FWER for the other tests is computed in the same way: the gene-associated variables (scores or counts) are permuted while the annotations of genes to GO-categories stay fixed. Then the statistical tests are evaluated again for every GO-category.
Hypergeometric Test Example 1
Suppose we randomly select 2 cards without replacement from an ordinary deck of playing cards. What is the probability of getting exactly 2 cards you want (i.e., Ace or 10)?
Solution: This is a hypergeometric experiment in which we know the following:
N = 52; since there are 52 cards in a deck. k = 16; since there are 16 Ace or 10 cards in a deck. n = 2; since we randomly select cards from the deck. x = 2; since 2 of the cards we select are red. We plug these values into the hypergeometric formula as follows:
h(x; N, n, k) = [ kCx ] [ N-kCn-x ] / [ NCn ]
h(2; 52, 2, 16) = [ 16C2 ] [ 48C1 ] / [ 52C2 ]
h(2; 52, 2, 16) = [ 325 ] [ 1 ] / [ 1,326 ]
h(2; 52, 2, 16) = 0.0904977
Thus, the probability of randomly selecting 2 Ace or 10 cards is 9%
| category | probability |
|---|---|
| probability mass f | 0.09049773755656108597285 |
| lower cumulative P | 1 |
| upper cumulative Q | 0.09049773755656108597285 |
| Expectation | 0.6153846153846153846154 |
Hypergeometric Test Example 2
Suppose we have 30 DEGs in human genome (200). What is the probability of getting 10 oncogene?
An oncogene is a gene that has the potential to cause cancer.
Solution: This is a hypergeometric experiment in which we know the following:
N = 200; since there are 200 genes in human genome k = 10; since there are 10 oncogenes in human n = 30; since 30 DEGs x = 5; since 5 of the oncogenes in DEGs.
We plug these values into the hypergeometric formula as follows:
h(x; N, n, k) = [ kCx ] [ N-kCn-x ] / [ NCn ]
h(5; 200, 30, 10) = [ 10C5 ] [ 190C25 ] / [ 200C30 ]
h(5; 200, 30, 10) = [ 252 ] [ 11506192278177947613740456466942 ] / [ 409681705022127773530866523638950880 ]
h(5; 200, 30, 10) = 0.007078
Thus, the probability of oncogene 0.7%.
hypergeometry.png
hypergeometric distribution value
| category | probability |
|---|---|
| probability mass f | 0.0070775932109153651831923063371216961166297 |
| lower cumulative P | 0.99903494867072865323201131115533112651846 |
| upper cumulative Q | 0.0080426445401867119511809951817905695981658 |
| Expectation | 1.5 |
False Discovery Rate (FDR) q-value
The false discovery rate (FDR) is a method of conceptualizing the rate of type I errors in null hypothesis testing when conducting multiple comparisons. FDR-controlling procedures are designed to control the expected proportion of “discoveries” (rejected null hypotheses) that are false (incorrect rejections).
- Benjamini–Yekutieli
- Benjamini–Hochberg
- Bonferroni-Selected–Bonferroni
- Bonferroni and Sidak
MetaScape
http://metascape.org/gp/index.html
REViGO
http://revigo.irb.hr/revigo.jsp
cleverGO
http://www.tartaglialab.com/GO_analyser/tutorial
DAVID
https://david.ncifcrf.gov/
Araport
http://araport.org
Paper read
Fu, Yu, et al. “Elimination of PCR duplicates in RNA-seq and small RNA-seq using unique molecular identifiers.” BMC genomics 19.1 (2018): 531 Parekh, Swati, et al. “The impact of amplification on differential expression analyses by RNA-seq.” Scientific reports 6 (2016): 25533 Klepikova, Anna V., et al. “Effect of method of deduplication on estimation of differential gene expression using RNA-seq.” PeerJ 5 (2017): e3091