Paper Reading
Please read this paper before class: Conesa et al. (2016) A survey of best practices for RNA-seq data analysis. Genome Biology 17:13
Overview: RNA Sequencing

RNA-Seq (RNA Sequencing) is the standard method for measuring genome-wide gene expression. Key characteristics:
- The transcriptome is spatially and temporally dynamic
- Data comes from functional units (coding regions)
- Only a small fraction of the genome is transcribed at any given time
Introduction
Sequence-based assays of transcriptomes (RNA-seq) are in wide use because of their favorable properties for quantification, transcript discovery, and splice isoform identification, as well as adaptability for numerous more specialized measurements. RNA-Seq studies present challenges shared with prior methods such as microarrays and SAGE tagging, and also new ones specific to high-throughput sequencing platforms.
RNA-Seq experiments are diverse in their aims and design goals, currently including multiple types of RNA isolated from whole cells or from specific sub-cellular compartments or biochemical classes, such as total polyA+ RNA, polysomal RNA, nuclear ribosome-depleted RNA, various size fractions of RNA and a host of others.
The RNA-Seq Workflow

Seven Stages of a Data Science Project
- Define the question of interest
- Get the data
- Clean the data
- Explore the data
- Fit statistical models
- Communicate the results
- Make your analysis reproducible
1. Experimental Design
Sample Information
Document the following for each sample:
| Item | Description |
|---|---|
| Material type | Tissue, cell line, primary cell type, etc. |
| Treatments | TALENs, CRISPR, drug treatment, etc. |
| Subcellular fraction | Whole cell, nuclear, cytoplasmic, etc. |
| Input amount | Bulk vs. low-input (affects reproducibility) |
| Lot/catalog # | For commercial cell lines |
| Culture protocol | If cells were propagated in vitro |
| QC/phenotyping | Purity confirmation methods |
RNA Information
Key properties to report:
- RNA type: Total RNA, Poly-A(+), Poly-A(-)
- Size fraction: >200 nt (long RNA) vs. <200 nt (small RNA)
- rRNA depletion: RiboMinus, RiboZero (note kit used)
Library Preparation Protocol
Document all steps:
- RNA isolation method
- Size selection method
- rRNA removal method
- Oligo-dT selection method
- DNase I treatment
Replicate Strategy
- Biological replicates: Minimum 3; recommended 6–12 (Schurch et al., 2016)
- Technical replicates: Not required for RNA-Seq (Marioni et al., 2008)
- Power analysis: Use tools like Scotty or RnaSeqSampleSize before starting
Reading Materials
- Auer & Doerge (2010) Statistical Design and Analysis of RNA Sequencing Data. Genetics 185:405–416
- Busby et al. (2013) Scotty: a web tool for designing RNA-Seq experiments. Bioinformatics 29:656–657
- Marioni et al. (2008) RNA-seq: an assessment of technical reproducibility. Genome Research
- Schurch et al. (2016) How many biological replicates are needed in an RNA-seq experiment? RNA 22:839
- Zhao et al. (2018) RnaSeqSampleSize: real data based sample size estimation. BMC Bioinformatics 19:191
2. Sequencing Parameters
Key Parameters to Report
| Parameter | Examples |
|---|---|
| Platform | Illumina NovaSeq, PacBio, Oxford Nanopore |
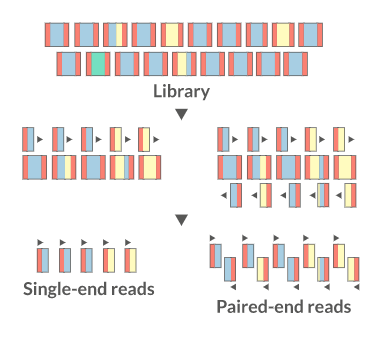
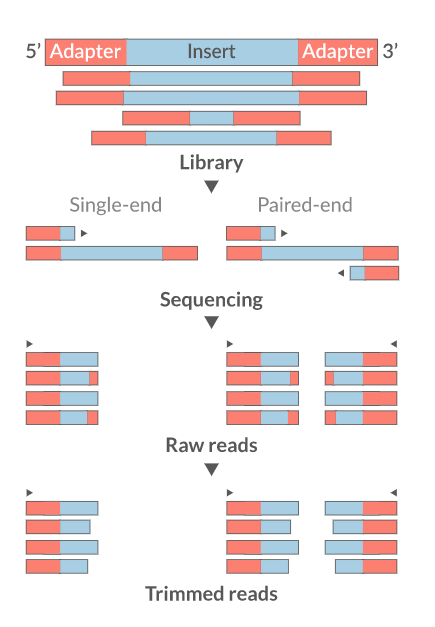
| Format | Single-end (SE) or Paired-end (PE) |
| Read length | 100 bp, 150 bp, 250 bp |
| Barcode placement | Standard or custom |
| Custom primers | Sequence and position |
Recommended Sequencing Depth
| Library Type | Minimum Aligned Read Pairs |
|---|---|
| Long RNA-Seq (polyA+) | 30 million |
| RAMPAGE | 20 million |
| Small RNA-Seq | 30 million |
Quantitative Standards (Spike-ins)
ERCC spike-in controls are highly recommended for calibrating quantification, sensitivity, and linearity.
Report:
- Stage of addition (before polyA selection, at cDNA synthesis, or prior to sequencing)
- FASTA file of spike-in sequences
- Source (ERCC, home-made, etc.)
- Concentration of each spike-in
3. Data Files and FASTQ Format
What is FASTQ?
FASTQ is a text-based format storing both nucleotide sequences and per-base quality scores.
Each record has exactly 4 lines:
@A00261:180:HL7GCDSXX:2:1101:30572:1047/2          # Line 1: header
AAAATACATTGATGACCATCTAAAGTCTACGGCGTAT...            # Line 2: sequence
+                                                   # Line 3: separator
FFFFFFFFFFFFFFFFFFFFFFFFFFFFFFFFFFF...              # Line 4: quality scores
Illumina Read Header Format
@Instrument:RunID:FlowcellID:Lane:Tile:X:Y/ReadNum
| Field | Example | Meaning |
|---|---|---|
| Instrument | A00261 | Instrument name |
| RunID | 180 | Run ID |
| FlowcellID | HL7GCDSXX | Flowcell ID |
| Lane | 2 | Flowcell lane |
| Tile | 1101 | Tile number within lane |
| X | 30572 | X-coordinate of cluster |
| Y | 1047 | Y-coordinate of cluster |
| ReadNum | /2 | Pair member (1 or 2) |
Phred Quality Scores
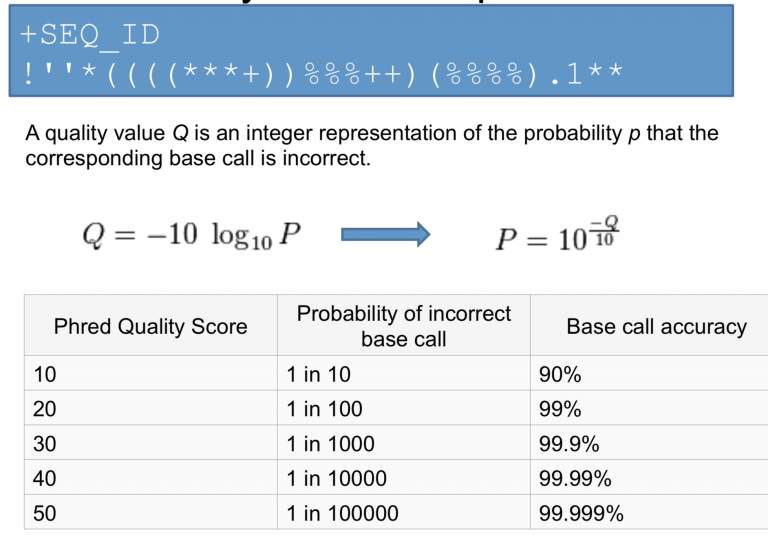
Quality scores represent the probability of an incorrect base call:
| Phred Score | Error Probability | Accuracy |
|---|---|---|
| Q10 | 1 in 10 | 90% |
| Q20 | 1 in 100 | 99% |
| Q30 | 1 in 1,000 | 99.9% |
| Q40 | 1 in 10,000 | 99.99% |
4. Hands-On: Setting Up the Environment
Create Working Directory
mkdir -p ~/bch709/rnaseq
cd ~/bch709/rnaseq
Create Conda Environment
conda create -n rnaseq python=3.11 -y
conda activate rnaseq
If your conda command is micromamba-based, use:
micromamba activate rnaseq
Install Tools
conda install -n rnaseq -c conda-forge -c bioconda \
  fastqc trim-galore hisat2 star samtools subread rsem 'multiqc<1.34' -y
If your default channel_priority is strict, keeping conda-forge before bioconda helps avoid dependency conflicts (for example, with multiqc).
Download Example Data
wget https://www.dropbox.com/s/y7yehmfze1l6cgz/pair1.fastq.gz
wget https://www.dropbox.com/s/xsrth6icapyr4p0/pair2.fastq.gz
ls -lh
Inspect a FASTQ File
zcat pair2.fastq.gz | head -12
Expected output (first 3 records):
@A00261:180:HL7GCDSXX:2:1101:18774:1125/2
ATACATTTTAACATAACTGTTTCAGAAAAACTTAAAAGCGGCAACAGAAGATAATAGAGAGAGACAAAGTATATCAAACAAAAGTTCATAGTCTTTCTTTTTTTCCCCAAACTTCAAATCCTTCTTCAGATCTTAAACCACATTTTCTCT
+
FFFFFFFFFFFFFFFFFFFFFFFFFFFFFFFFFFFFFFFFFFFFFFF:FFFFFFFFFFFFFFFFFFF:FF:FFFFFFFFFFFFFFFFFFFFFFFFFFFFFFFFFFFFFFFFFFFFFFFFFFF,FFFFFFFFFFFFFFFFFFFFFFFFFFF
@A00261:180:HL7GCDSXX:2:1101:28275:1141/2
CTCGAAGTATTAAGCAAGCACAGGGACAAGTATCATGAGTTGTTACTATCTGATTGCCGTAAACAGATCACAGAAGCTTTATCAGCAGATAAGTTTGAGCAGATGTTGATGAAGAAAGAATATGAGTATTCCATGAATGTGCTCTCTTTC
+
:FFFFF::FFFFFFFFFFFFFFFFFFFFFFF,FFF:FFFFFFFFFFFF::FFFFFF:F::FFF:FFFF,F:F:FF:FF:FFFFF:FFFFFFFF,F:FFF:FFF,FF:FFFFFFFFFFFFFFFFFFFFFFFF,FFFFFFFFFFFF:FF,:,
@A00261:180:HL7GCDSXX:2:1101:5954:1438/2
CGAGCTTACAATCTTTCTCAACAAACTGTATAACGCAGTAAGAAAGCTGTTGATGGTAATTTGGTAAGCATTTCAGCTTGTGCAGAGGAATCAAGACACGAGTAAGAAAGAGCTTGTGTTCTTCCTTGAGTGGTAAAGCGAATCCATTGA
+
FFFFFFFFFFFFFFFFFFFFFFFFFFFFFFFFFFFFFF,FFFFFFFF:FFFFFFFFF,:FFFFFFFFFFFFFFFFFFFFFFFFFFFFFF:FFFFFFFFFFFFFFFFF:FFFFFFFFFFFFFFFFFFFFFFFFFFFFFFFFFFFFFFFFFF
5. Quality Control
What to Check
| Metric | Tool |
|---|---|
| Number of reads | FastQC |
| Per-base sequence quality | FastQC |
| Per-sequence GC content | FastQC |
| Per-base N content | FastQC |
| Sequence length distribution | FastQC |
| Adapter content | FastQC |
| Duplication levels | FastQC |
Run FastQC
fastqc -t 4 pair1.fastq.gz pair2.fastq.gz
Aggregate QC Reports with MultiQC

MultiQC aggregates results from multiple tools into a single interactive report.
multiqc . --exclude rsem --exclude gatk
Open Reports in Your Browser
MultiQC generates an HTML report in your working directory. Open it directly:
macOS:
open multiqc_report.html
Linux:
xdg-open multiqc_report.html
Windows (WSL):
explorer.exe multiqc_report.html
6. Read Trimming
Why Trim?
- Remove adapter sequences
- Trim low-quality bases from read ends
- Remove reads that are too short (< 18 nt)
- Improve downstream alignment accuracy
Common Trimming Tools
| Tool | Link |
|---|---|
| Trim Galore | link |
| fastp | link |
| Cutadapt | link |
| Trimmomatic | link |
| Skewer | link |
Run Trim Galore
cd ~/bch709/rnaseq

trim_galore \
  --paired \
  --three_prime_clip_R1 5 \
  --three_prime_clip_R2 5 \
  --cores 4 \
  --max_n 40 \
  --fastqc \
  --gzip \
  -o trim \
  pair1.fastq.gz pair2.fastq.gz
Post-Trimming QC Report
multiqc --dirs ~/bch709/rnaseq --filename trim --exclude rsem --exclude gatk
7. Alignment (Mapping)
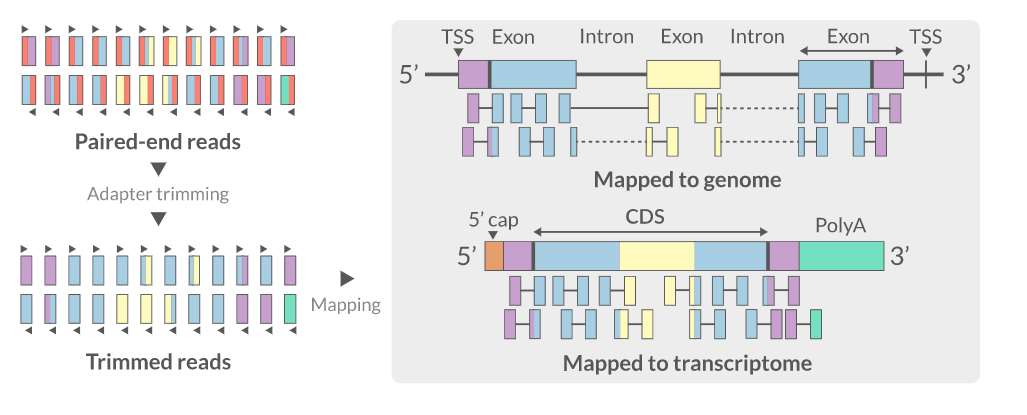
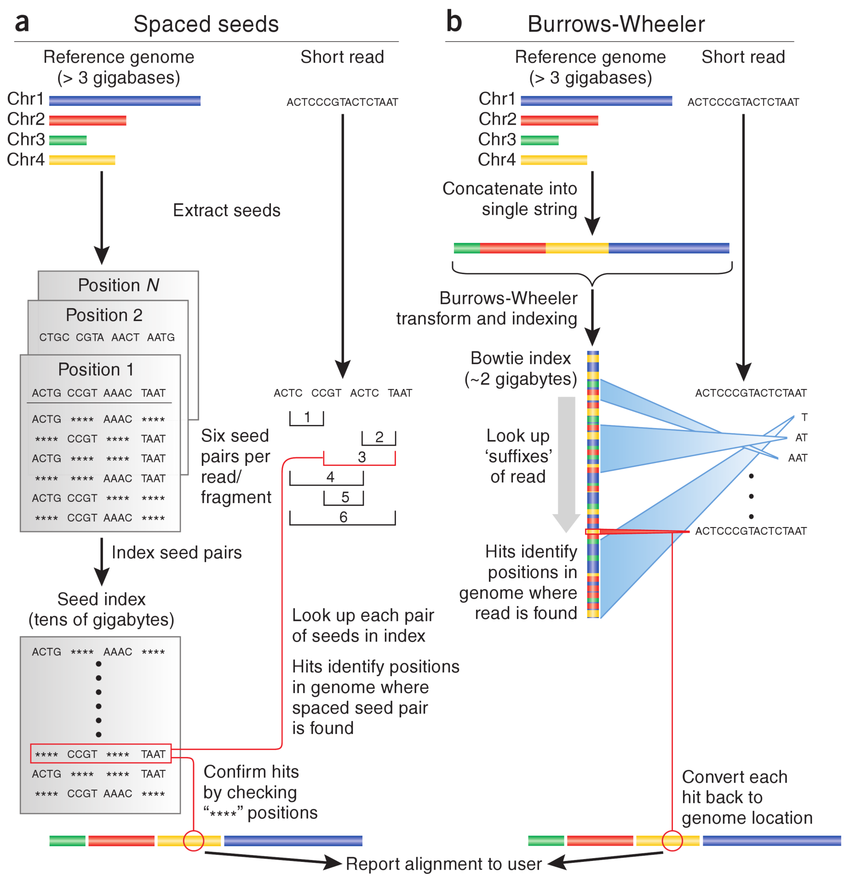
For RNA-Seq, reads must be aligned to a reference genome using a splice-aware aligner that can span intron-exon junctions.
Common RNA-Seq Aligners
| Aligner | Algorithm | Link |
|---|---|---|
| HISAT2 | Graph FM index (BWT-based) | paper |
| STAR | Suffix arrays | paper |
| GSNAP | SNP/indel-aware | paper |
Download Reference Files
cd ~/bch709/rnaseq

wget https://www.dropbox.com/s/851ob9e3ktxhyxz/bch709.fasta
wget https://www.dropbox.com/s/e9dvdkrl9dta4qg/bch709.gtf
Build HISAT2 Index
hisat2-build bch709.fasta bch709
Align Reads
The --dta flag is required when using HISAT2 output with featureCounts or StringTie for downstream quantification. Pipe directly to samtools sort to skip writing the intermediate SAM file to disk.
hisat2 \
  -x bch709 \
  --threads 4 \
  --dta \
  -1 trim/pair1_val_1.fq.gz \
  -2 trim/pair2_val_2.fq.gz \
  --summary-file alignment.txt \
  | samtools sort -@ 4 -o align_sort.bam

samtools index align_sort.bam
cat alignment.txt
Expected output (alignment.txt):
1581474 reads; of these:
  1581474 (100.00%) were paired; of these:
    13578 (0.86%) aligned concordantly 0 times
    1545720 (97.74%) aligned concordantly exactly 1 time
    22176 (1.40%) aligned concordantly >1 times
    ----
    13578 pairs aligned concordantly 0 times; of these:
      868 (6.39%) aligned discordantly 1 time
    ----
    12710 pairs aligned 0 times concordantly or discordantly; of these:
      25420 mates make up the pairs; of these:
        13870 (54.56%) aligned 0 times
        11371 (44.73%) aligned exactly 1 time
        179 (0.70%) aligned >1 times
99.56% overall alignment rate
8. SAM/BAM Format
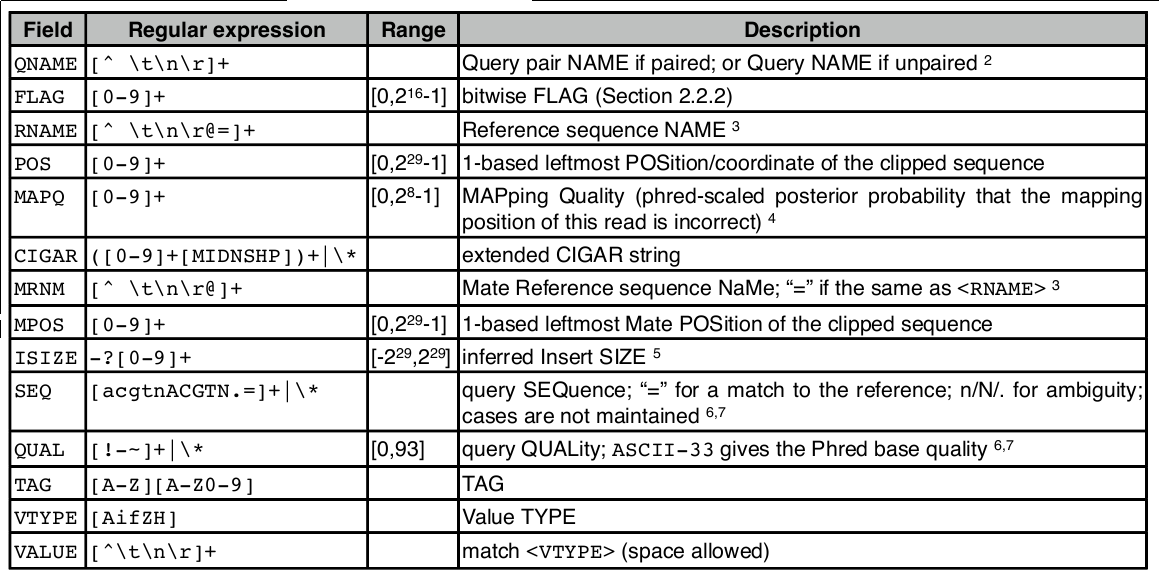
SAM Record Format
<QNAME> <FLAG> <RNAME> <POS> <MAPQ> <CIGAR> <MRNM> <MPOS> <ISIZE> <SEQ> <QUAL> [TAGS]
SAM Flags
SAM flags are bitwise integers encoding alignment properties (strand, pairing, etc.):
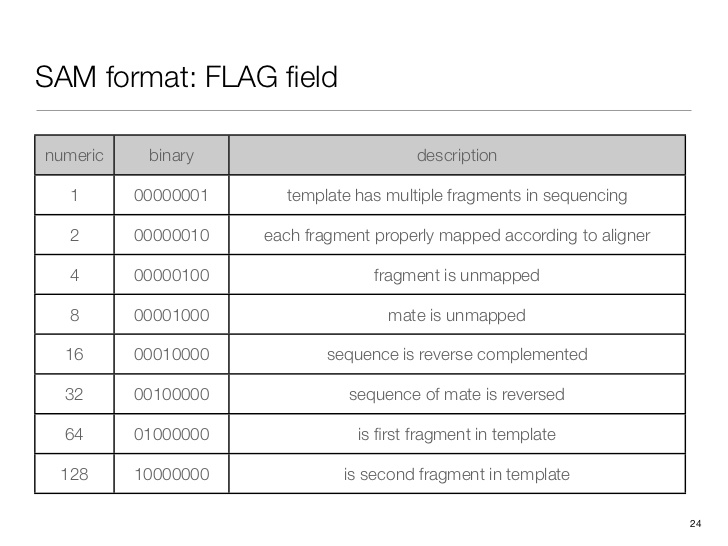
Convert a decimal flag to binary to interpret it:
python3 -c "print(bin(163))"
# or, if `bc` is installed (not always on HPC login nodes):
echo 'obase=2; 163' | bc
Expected output:
0b10100011
Check what a flag means: SAM Flag Decoder
SAM Optional Tags
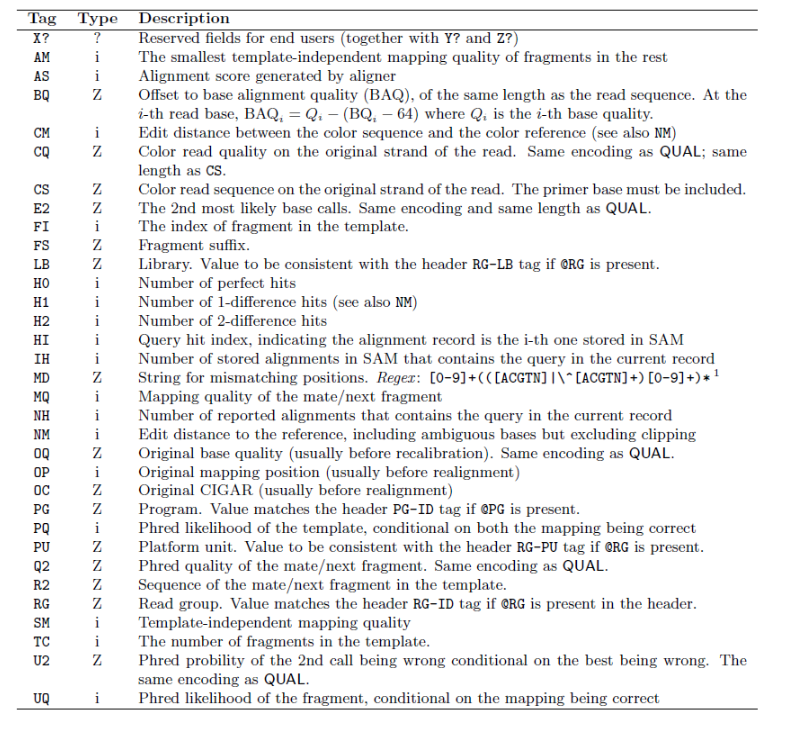
Full SAM specification: samtools.github.io/hts-specs
9. BAM Processing with SAMtools
SAMtools provides utilities for manipulating SAM/BAM files: sorting, indexing, filtering, and statistics.
Coordinate-sorted and indexed BAM files are the standard input for most downstream tools (featureCounts, IGV, many QC utilities).
If you aligned without piping (produced a SAM file), convert and sort it:
samtools view -Sb align.sam | samtools sort -@ 4 -o align_sort.bam
samtools index align_sort.bam
What These Commands Do
| Command | Purpose | Typical use |
|---|---|---|
samtools view |
Convert/filter alignments | Convert SAM to BAM; filter by flags or regions |
samtools sort |
Coordinate-sort BAM | Required before indexing and most visualization |
samtools index |
Create .bai index |
Enables fast random access to genomic regions |
samtools flagstat |
Quick mapping summary | Read-level QC (mapped %, paired %, duplicates) |
samtools idxstats |
Per-reference counts | Check chromosome/contig-level mapping balance |
samtools stats |
Detailed metrics | Insert size, mismatch profile, coverage summaries |
Practical QC Commands
# Quick integrity check (silent if OK)
samtools quickcheck -v align_sort.bam

# Read-level summary
samtools flagstat -@ 4 align_sort.bam > align_sort.flagstat.txt

# Per-reference mapped/unmapped counts
samtools idxstats align_sort.bam > align_sort.idxstats.txt

# Detailed alignment statistics
samtools stats -@ 4 align_sort.bam > align_sort.bam.stat

# Show the first summary lines (SN = Summary Number)
grep '^SN' align_sort.bam.stat | head -20
Expected output (samtools flagstat):
3223020 + 0 in total (QC-passed reads + QC-failed reads)
3162948 + 0 primary
60072 + 0 secondary
0 + 0 supplementary
0 + 0 duplicates
0 + 0 primary duplicates
3209150 + 0 mapped (99.57% : N/A)
3149078 + 0 primary mapped (99.56% : N/A)
3162948 + 0 paired in sequencing
1581474 + 0 read1
1581474 + 0 read2
3135792 + 0 properly paired (99.14% : N/A)
3138530 + 0 with itself and mate mapped
10548 + 0 singletons (0.33% : N/A)
226 + 0 with mate mapped to a different chr
226 + 0 with mate mapped to a different chr (mapQ>=5)
Expected output (samtools idxstats):
Chr3	5268426	2205946	6542
Chr4	6078366	1003204	4006
*	0	0	3322
Useful Flag Filters
# Total aligned records
samtools view -c align_sort.bam

# Mapped reads only (-F 4 removes unmapped)
samtools view -c -F 4 align_sort.bam

# Properly paired reads only (for paired-end data)
samtools view -c -f 2 align_sort.bam
Expected output (counts on the validated bch709 data):
all records:        3223020
mapped (-F 4):      3209150
properly paired:    3195650
File Size Comparison
| Format | Size | Notes |
|---|---|---|
| SAM (align.sam) | ~903 MB | Text format; avoid writing to disk if possible |
| BAM (align_sort.bam) | ~166 MB | Binary, ~5× smaller |
Visualize Alignments
# Terminal viewer
COLUMNS=150 samtools tview -d t align_sort.bam bch709.fasta
GUI Viewers:
Alignment QC
# MultiQC aggregates flagstat/stats outputs into one report
multiqc --dirs ~/bch709/rnaseq --filename align --exclude rsem --exclude gatk
Key Alignment Metrics
| Metric | Tool |
|---|---|
| Total/mapped/properly paired reads | samtools flagstat |
| Mapped reads per chromosome/contig | samtools idxstats |
| Mapping rate, pairing | samtools stats |
| Insert size distribution | samtools stats |
| Gene body coverage | RSeQC |
| Strand specificity | RSeQC |
| Biotype counts | QoRTs |
| Sequencing saturation | QoRTs |
10. Read Quantification
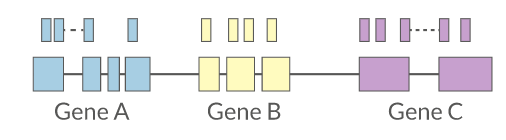
Reads overlapping annotated gene features are counted as a proxy for gene expression.
Quantification Tools
| Tool | Approach |
|---|---|
| featureCounts | Fast, summarizes reads per gene/exon |
| HTSeq | Python-based, flexible |
| RSEM | Transcript-level, EM-based |
| Salmon | Quasi-mapping, very fast |
| Kallisto | Pseudoalignment |
EM-Based Quantification (STAR + RSEM)
EM (Expectation-Maximization) is useful when a read can map to multiple isoforms or genes.
- E-step: assign each ambiguous read fractionally to candidate transcripts using current abundance estimates
- M-step: update transcript abundance estimates from those fractional assignments
- Repeat E/M until estimates converge
This is why EM-based tools (for example, RSEM) are commonly used for transcript-level quantification.
STAR --quantMode GeneCountsgives simple gene counts and is not EM-based.
For EM quantification, use STAR transcriptome BAM + RSEM.
# 1) Build STAR genome index (one-time)
# For small genomes (<100 Mb), drop --genomeSAindexNbases to ~10
# (rule of thumb: min(14, log2(GenomeLength)/2 - 1)); the default 14
# is sized for human-scale references and triggers a WARNING here.
mkdir -p star_index
STAR \
  --runThreadN 4 \
  --runMode genomeGenerate \
  --genomeDir star_index \
  --genomeFastaFiles bch709.fasta \
  --sjdbGTFfile bch709.gtf \
  --sjdbOverhang 99 \
  --genomeSAindexNbases 10

# 2) Build RSEM reference (one-time)
mkdir -p rsem_ref
rsem-prepare-reference --gtf bch709.gtf bch709.fasta rsem_ref/bch709

# 3) STAR alignment with transcriptome BAM output
STAR \
  --runThreadN 4 \
  --genomeDir star_index \
  --readFilesIn trim/pair1_val_1.fq.gz trim/pair2_val_2.fq.gz \
  --readFilesCommand zcat \
  --quantMode TranscriptomeSAM \
  --outSAMtype BAM SortedByCoordinate \
  --outFileNamePrefix star_

# 4) EM-based expression estimation by RSEM
rsem-calculate-expression \
  --alignments \
  --paired-end \
  --num-threads 4 \
  star_Aligned.toTranscriptome.out.bam \
  rsem_ref/bch709 \
  sample1
Key output files:
sample1.genes.resultssample1.isoforms.results
Useful columns:
expected_count: EM-estimated read countTPM: length-normalized expression
Expected output (sample1.genes.results, first rows):
gene_id        transcript_id(s)   length    effective_length   expected_count   TPM      FPKM
Chr3_gene_1    Chr3_mRNA_1        853.00    590.34             99.00            201.63   191.14
Chr3_gene_10   Chr3_mRNA_10       3216.00   2953.34            684.00           278.46   263.97
Chr3_gene_100  Chr3_mRNA_100      3426.00   3163.34            2135.00          811.48   769.25
Chr3_gene_1000 Chr3_mRNA_1000     327.00    68.56              12.00            210.44   199.49
Run featureCounts
The -p flag is for paired-end reads. Add -T 4 to use multiple threads. The -s flag sets strandedness (0=unstranded, 1=forward, 2=reverse).
featureCounts \
  -p \
  -T 4 \
  -a bch709.gtf \
  -o counts.txt \
  align_sort.bam

# View the count matrix (skip the first commented header line)
grep -v "^#" counts.txt | head
Expected output (counts.txt.summary):
Status                          align_sort.bam
Assigned                        1458491
Unassigned_Unmapped             1661
Unassigned_MultiMapping         52472
Unassigned_NoFeatures           96306
Unassigned_Ambiguity            2685
Expected output (counts.txt, first rows):
Geneid          Chr             Start           End             Strand  Length  align_sort.bam
Chr3_gene_1     Chr3;Chr3;Chr3;Chr3   29;343;749;1701   245;684;865;1877   -;-;-;-   853   206
Chr3_gene_2     Chr3;Chr3             2360;2714         2580;3146          +;+       654   659
Chr3_gene_3     Chr3;Chr3;Chr3;Chr3;Chr3   3593;3867;4133;4337;4748   3757;4022;4231;4659;5432   -;-;-;-;-   1428   1461
PCR Duplicates
For RNA-Seq, PCR duplicates are generally not removed because many identical reads reflect true high-abundance transcripts.
- Do NOT computationally deduplicate standard RNA-Seq
- Use UMIs during library prep if deduplication is needed
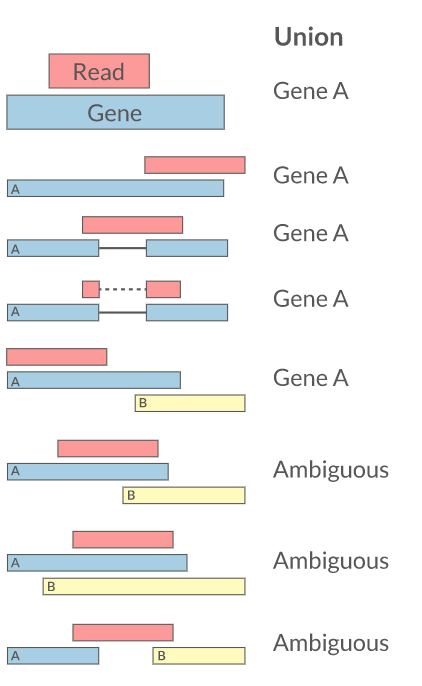
Multi-Mapping Reads
| Strategy | Tool |
|---|---|
| Discard multi-mappers | featureCounts, HTSeq |
| Distribute counts | Cufflinks |
| Probabilistic (EM) | RSEM |
| Prioritize features | Rcount |
Reference
- Fu et al. (2018) Elimination of PCR duplicates in RNA-seq using UMIs. BMC Genomics 19:531
- Parekh et al. (2016) The impact of amplification on differential expression. Scientific Reports 6:25533
11. Differential Expression Analysis
After generating a count matrix, the next step is testing for statistically significant differences between conditions.
Common Tools
| Tool | Model | Notes |
|---|---|---|
| DESeq2 | Negative binomial | Recommended for small n |
| edgeR | Negative binomial | GLM-based |
| Limma-Voom | Normal (after voom) | Good for large studies |
Downstream: Functional Analysis
- Gene Ontology (GO) enrichment — hypergeometric test
- GSEA — gene set enrichment analysis
- Pathway analysis — KEGG, Reactome
12. Full Workflow Summary
Raw FASTQ
    │
    ├── FastQC → MultiQC (QC report)
    │
    ├── Trim Galore (adapter/quality trimming)
    │       │
    │       └── FastQC → MultiQC (post-trim QC)
    │
    ├── HISAT2 (alignment to genome)
    │       │
    │       └── SAMtools (sort, index, stats)
    │
    ├── featureCounts (read quantification)
    │
    └── DESeq2 / edgeR (differential expression)
            │
            └── GO / GSEA (functional enrichment)
13. Cleanup
conda deactivate
# Optional: remove the environment when done
conda env remove --name rnaseq
If you are using micromamba:
micromamba deactivate
micromamba env remove -n rnaseq
References
| Resource | Link |
|---|---|
| Conesa et al. (2016) Best practices for RNA-seq | Genome Biology |
| ENCODE RNA-Seq Standards | Hong et al. 2016 |
| QC Fail blog | sequencing.qcfail.com |
| Conda documentation | docs.conda.io |
| BioConda | bioconda.github.io |